
- Title
-
A Lateral Line Specific Mucin Involved in Cupula Growth and Vibration Detection in Zebrafish
- Authors
- Ma, Z., Tian, Y., Wang, Y., Wang, C., Wang, J., Fan, C.
- Source
- Full text @ Int. J. Mol. Sci.
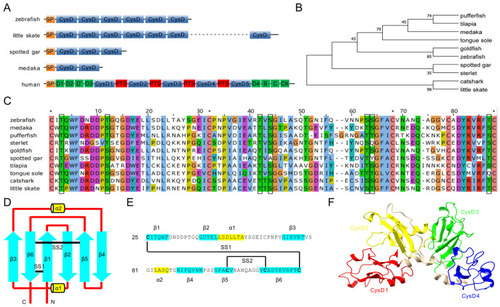
Structure, multiple alignment, and phylogenetic tree of Mucin-5AC proteins. ( |
Zebrafish |
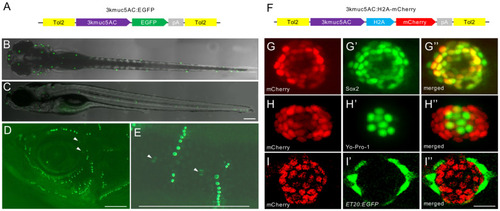
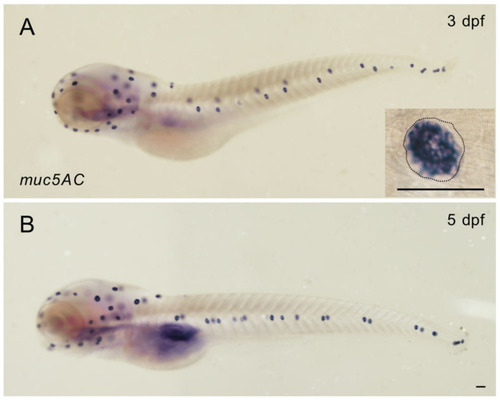
Characterization of the expression pattern of |
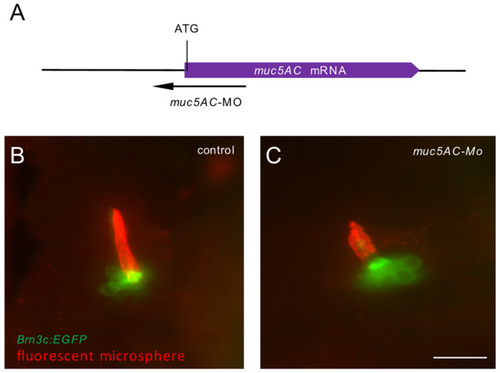
Knockdown of |
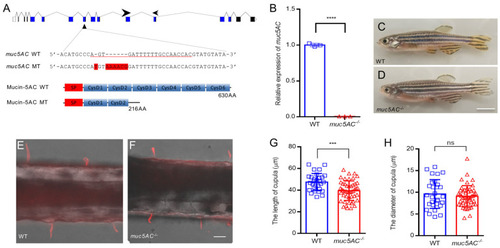
Mutation of |
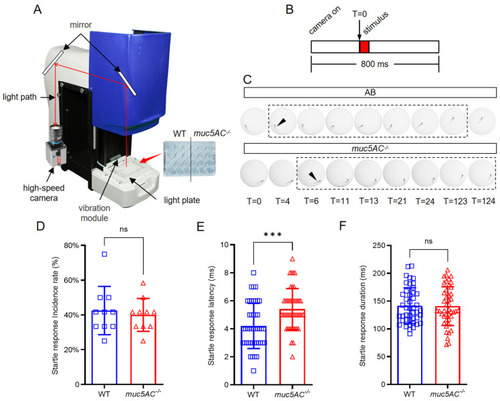
Deficiency of |
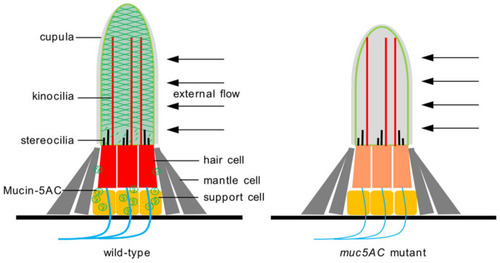
Schematic diagram of the cupula in wild-type and |