IMAGE

Figure 3

ID
ZDB-IMAGE-250127-139
Source
Figures for Ma et al., 2025
Image
Figure Caption

Figure 3

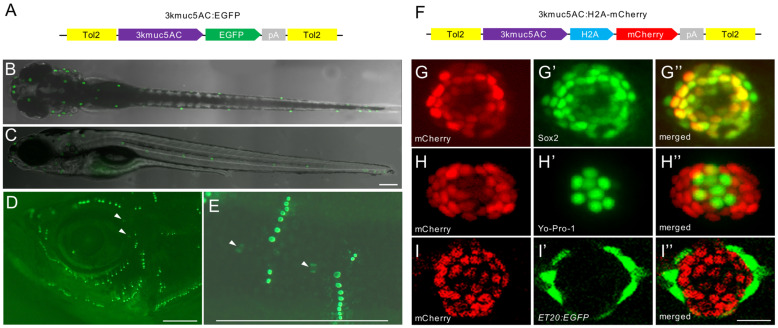
Characterization of the expression pattern of Tg(3kmuc5AC:EGFP) and Tg(3kmuc5AC:EGFP). (A) Schematic diagram of the Tol2 construct used to generate the Tg(3kmuc5AC:EGFP) reporter. (B,C) Dorsal view and lateral view of a Tg(3kmuc5AC:EGFP) larva at 5 dpf. Scale bars: 200 μm. (D,E) Head and posterior region of operculum shown by Tg(3kmuc5AC:EGFP) in adult zebrafish. White arrows label canal neuromasts. Scale bars in D and E: 1 mm. (F) Schematic diagram of the Tol2 construct used to generate the Tg(3kmuc5AC:H2A-mCherry) reporter. (GG”) Immunostaining with anti-mCherry (red) and anti-Sox2 (green). (HH”) Live imaging of Tg(3kmuc5AC:H2A-mCherry) (red) stained with Yo-Pro-1 (green). (II”) Live imaging of Tg(3kmuc5AC:H2A-mCherry) (red) and Tg(ET20:EGFP) (green) double transgenic line. Scale bars: 20 μm.

Acknowledgments
This image is the copyrighted work of the attributed author or publisher, and ZFIN has permission only to display this image to its users. Additional permissions should be obtained from the applicable author or publisher of the image. Full text @ Int. J. Mol. Sci.