FIGURE

Figure 6

ID
ZDB-FIG-250127-140
Publication
Ma et al., 2025 - A Lateral Line Specific Mucin Involved in Cupula Growth and Vibration Detection in Zebrafish
Other Figures
All Figure Page
Back to All Figure Page
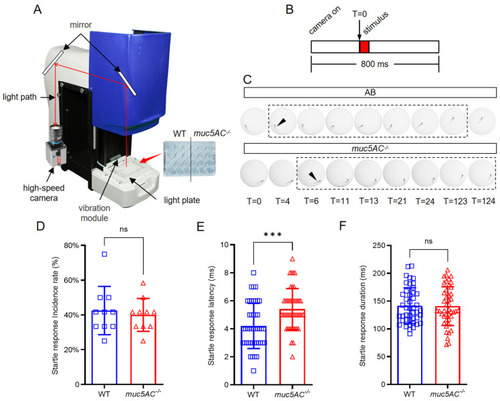
Figure 6

Deficiency of muc5AC increases the startle response latency. (A) Schematic diagram of the setup for vibration-induced startle response assay. The vibration module in Zebrabox is set to 70% maximum intensity and a frequency of 400 Hz. A high-speed camera is used to detect the movement of larvae. (B) Schematic diagram of the startle response experiment. T = 0 is the time when vibration stimuli is delivered. (C) Stages of the startle response of wild-type and muc5AC mutant larvae at 5 dpf. T = 0 represents stimulus onset. Arrowheads point to the detectable movement. Dashed rectangles highlight the whole process of startle response. T, ms. (D) Quantification of the short-latency startle response incidence rate in wild-type and muc5AC mutant larvae at 5 dpf. (E) Quantification of the short-latency startle response time in wild-type and muc5AC mutant larvae at 5 dpf. (F) Quantification of the startle response duration time in wild-type and muc5AC mutant larvae at 5 dpf. ***, p < 0.001; ns, not significant.

Expression Data

Expression Detail
Antibody Labeling
Phenotype Data

Phenotype Detail
Acknowledgments
This image is the copyrighted work of the attributed author or publisher, and ZFIN has permission only to display this image to its users. Additional permissions should be obtained from the applicable author or publisher of the image. Full text @ Int. J. Mol. Sci.