
- Title
-
Phenotypic screening in zebrafish larvae identifies promising cyanobacterial strains and pheophorbide a as insulin mimetics
- Authors
- Ribeiro, T., Reis, M., Vasconcelos, V., Urbatzka, R.
- Source
- Full text @ Sci. Rep.
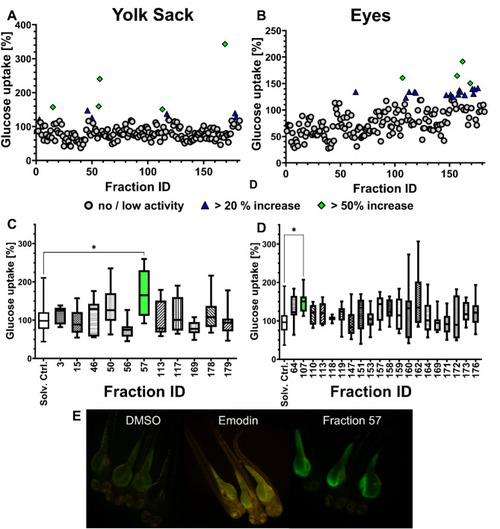
Screening for insulin mimetic activity in zebrafish larvae exposed to cyanobacterial fractions using the 2-NBDG assay. Percentage of glucose uptake relative to solvent control (DMSO 0.1%) was evaluated. 182 fractions were screened and fluorescence was quantified in the yolk sac (A) and in the eye (B). Fractions with an increase > 20% are shown in blue, and > 50% in green. Promising fractions from the initial screening were tested in an additional assay. Fractions marked in green increased significantly 2-NBDG uptake in the yolk sac (C) or eye (D). The data is represented as box-whisker plots from the fifth to 95th percentiles. Asterisks highlight significantly altered fluorescence intensities that indicate changes in 2-NBDG uptake (* |

Glucose measurement on 4 dpf zebrafish embryos, exposed to Fraction 06104_D and 03283_B (at 10 µg/mL and 20 µg/mL), as well to the solvent control, DMSO (0.1%), and positive control, T3 (10 µM). Three replicates were used in two independent assays, |
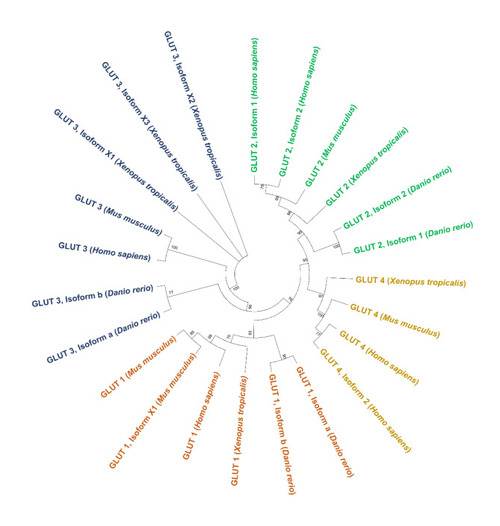
The evolutionary history of glucose transporters (GLUT 1–3) with the sequences of |

Western blot analysis of glucose transporters (GLUTs). A and B: GLUT expression from whole zebrafish embryos (3 dpf) and from head, and body, including the yolk sac. The expression of each GLUT and respective β-actin on the membrane is shown on A (top GLUT, bottom β-actin). B: quantification of the relative expression of each GLUT normalized by β-actin. C: GLUT protein level from zebrafish embryos (3 dpf) normalized to β-actin, after exposure to fractions 06104_D and 03283_B at 10 µg/ml and Emodin at 10 µM, using DMSO (0.1%) as solvent control. Three replicates consisting of a pool of 16 larvae each were used per condition in two independent assays ( |
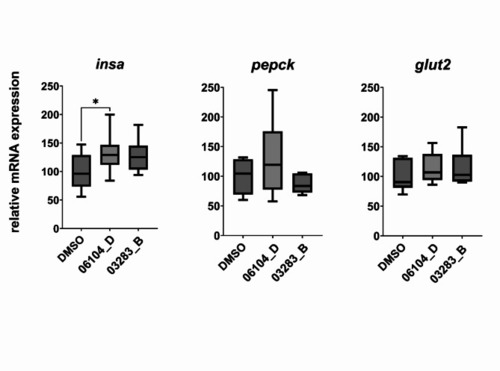
Relative mRNA expression of |

Cytoscape visualization of the main clusters of the final molecular network of fraction 06104_D (TOP) and 03283_B (BOTTOM), for each GNPS analysis approach. Compound families’ identifications were done using ClassyFire |

2-NBDG uptake on zebrafish larvae exposed to pheophorbide a, a member of the chlorophyll derivatives. Zebrafish larvae were exposed to pheophorbide a at 10 µM and 20 µM for 1 h, and 2 independent assays were done for each sample ( |
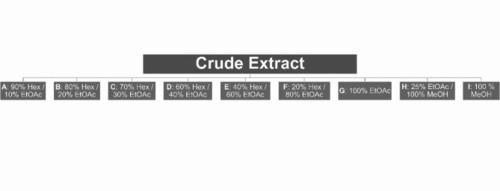
Solvent gradient used for VLC fractionation of crude extracts of the 19 cyanobacteria strains. Solvent proportions are identified by the letters A-I as shown in the figure. |