
FIGURE
Fig. 3
- ID
- ZDB-FIG-250109-104
- Publication
- Ribeiro et al., 2024 - Phenotypic screening in zebrafish larvae identifies promising cyanobacterial strains and pheophorbide a as insulin mimetics
- Other Figures
- All Figure Page
- Back to All Figure Page
Fig. 3
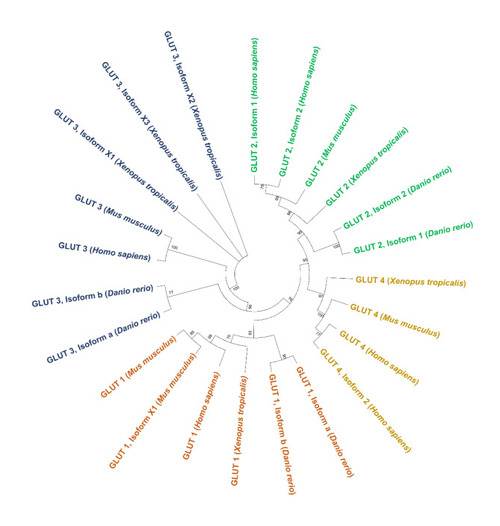
The evolutionary history of glucose transporters (GLUT 1–3) with the sequences of |
Expression Data
Expression Detail
Antibody Labeling
Phenotype Data
Phenotype Detail
Acknowledgments
This image is the copyrighted work of the attributed author or publisher, and
ZFIN has permission only to display this image to its users.
Additional permissions should be obtained from the applicable author or publisher of the image.
Full text @ Sci. Rep.