
- Title
-
Human enteric glia diversity in health and disease: new avenues for the treatment of Hirschsprung disease
- Authors
- Windster, J.D., Kakiailatu, N.J.M., Kuil, L.E., Antanaviciute, A., Sacchetti, A., MacKenzie, K.C., Peulen-Zink, J., Kan, T.W., Bindels, E., de Pater, E., Doukas, M., van den Bosch, T.P.P., Yousefi, S., Barakat, T.S., Meeussen, C., Sloots, C.E.J., Wijnen, R.M.H., Parikh, K., Boesmans, W., Melotte, V., Hofstra, R.M.W., Simmons, A., Alves, M.M.
- Source
- Full text @ Gastroenterology
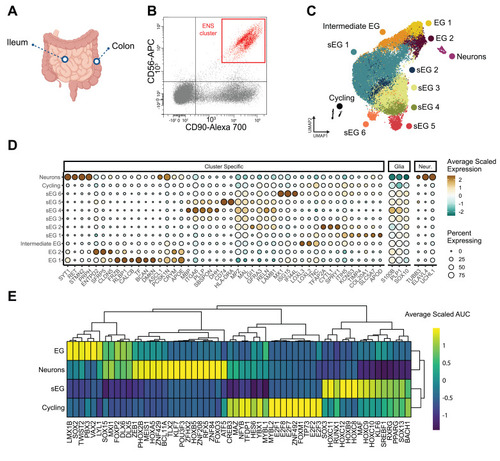
A single-cell transcriptomic landscape of the pediatric ENS. (A) Schematic of human gut tissue sampling. (B) ENS cells were enriched via CD56+CD90+ in an FACS plot. (C) Uniform manifold approximation and projection visualization showed unsupervised clustering of healthy control ileum and colon ENS cells, indicating the presence of canonical enteric glia 1–2 (EG 1–2) and Schwann-like enteric glia 1–6 (sEG 1–6). (D) Dot plot showing expression of differentially expressed genes across different cell clusters. (E) Heat map showing differentially expressed transcription factors stratified by major classes of captured cells. AUC, area under the curve. |
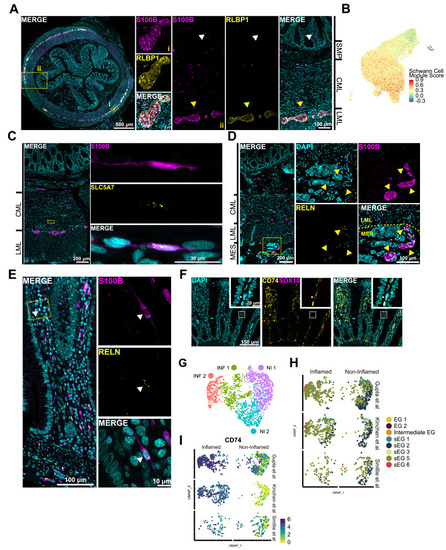
Enteric glial (EG) clusters align with previously defined morphologic subtypes along the gut–wall axis. (A) Immunohistochemical validation of RLBP1 expression showing colocalization with S100B+ in type I protoplasmic glia located within EG (i). Yellow arrowheads indicate RLBP1+ type I intraganglionic glia (ii). White arrowheads indicate type IIImucosa RLBP1– glia (ii). (B) Uniform manifold approximation and projection (UMAP) visualization showing a computed Schwann module score for all cells in our dataset. Schwann-like enteric glia (sEG) 1–6 have the highest transcriptional resemblance to Schwann cells. (C) FISH combined with immunohistochemistry for S100B shows SLC5A7 expression in bipolar type IV EG. (D) FISH combined with immunohistochemistry for S100B, localizes RELN expression in extrinsic nerve fibers (yellow arrowheads), as well as in (E) type IIImucosa EG adjacent to the epithelium (white arrowhead). (F) FISH combined with immunohistochemistry for S100B, localizes CD74 expression in the lamina propria adjacent to the epithelium. (G) UMAP visualization showing integrated single-cell data from 3 public datasets obtained from mucosal biopsies of patients with inflammatory bowel conditions. (H) UMAP visualization showing single-cell data from 3 public datasets cross-labeled with our pediatric EG classification. (I) Feature plots showing differential expression of CD74 in inflamed and noninflamed tissue. CML, circular muscle layer; DAPI, 4′,6-diamidino-2-phenylindole; INF, inflamed; LML, longitudinal muscle layer; MES, mesentery; NI, noninflamed; SMP, submucosal plexus. |
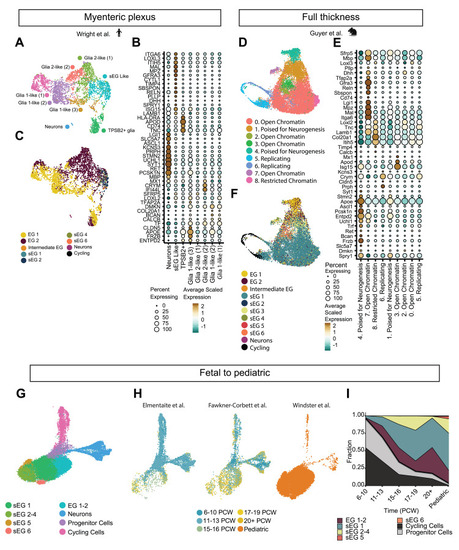
Integration of the pediatric glial transcriptome across species and time. (A) Uniform manifold approximation and projection (UMAP) visualization showing ENS single-nuclei sequencing data from adult human myenteric plexus. (B) Dot plot showing differentially expressed genes across cell clusters. (C) UMAP visualization showing ENS nuclei cross-labeled with our pediatric enteric glia (EG) classification. (D) UMAP visualization showing ENS scRNA-seq data from full-thickness mouse intestine (P14). (E) Dot plot showing differentially expressed genes across cell clusters. (F) UMAP visualization showing scRNA-seq data from full-thickness P14 mouse tissue cross-labeled with our pediatric EG classification. (G) UMAP visualization showing integration of pediatric and fetal ENS, partially cross-labeled with our pediatric glia annotation. (H) UMAP visualization of each individual dataset colored according to age groups. (I) Proportion plot depicting the relative abundance of glial, cycling, and progenitor clusters across developmental time points. PCW, postconceptual weeks; sEG, Schwann-like enteric glia. |
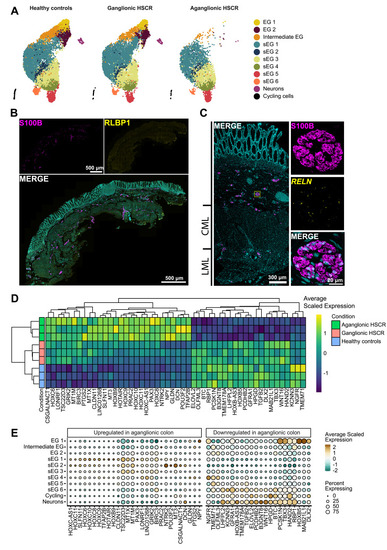
The molecular landscape of the ENS of individuals with HSCR is dominated by Schwann-like enteric glia (sEG). (A) Uniform manifold approximation and projection (UMAP) visualizations of control, ganglionic, and aganglionic ENS cells. Canonical enteric glia 1–2 (EG 1–2), intermediate EG, and neurons are absent in aganglionic HSCR colon. (B) Immunohistochemistry shows that RLBP1+ glia are absent in aganglionic colon. (C) FISH combined with immunohistochemistry for S100B, localizes RELN expression in glia present in extrinsic hypertrophic nerve fibers in the aganglionic colon. (D) Heat map showing differentially expressed genes stratified by condition. (E) Dot plot showing differential gene expression in aganglionic colon compared with healthy tissue, for each individual cluster. CML, circular muscle layer; LML, longitudinal muscle layer. |
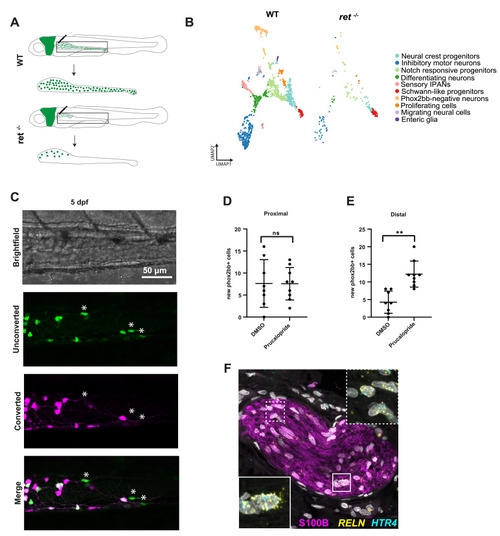
Schwann precursor–like cells are preserved in ret-/- zebrafish and are amenable to prucalopride-induced neurogenesis. (A) Graphical representation of gut isolation for scRNA-seq of 5-dpf tg(phox2bb:GFP) wild-type (WT) and ret-/- zebrafish. (B) UMAP visualization of WT and ret–/– zebrafish ENS subsets. (C) Live imaging of 5-dpf tg(phox2bb:kaede) photoconverted ret+/– zebrafish, treated with prucalopride. New phox2bb:kaede+ cells are indicated by asterisks (∗). (D) Quantification of new phox2bb:kaede+ cells in the proximal and (E) distal regions of DMSO (n = 8) and prucalopride (n = 9) treated 5-dpf photoconverted ret+/– tg(phox2bb:kaede) zebrafish. Statistical significance was calculated using Student t tests, ns > .05; ∗∗P < .01. (F) FISH combined with immunohistochemistry shows the presence of S100B+/RELN+/HTR4+ enteric glia located within hypertrophic nerve trunks in aganglionic colon (n = 3). In the insets, S100B staining is omitted for better appreciation of the FISH signal. IPAN, Intrinsic primary afferent neuron. PHENOTYPE:
|