
|
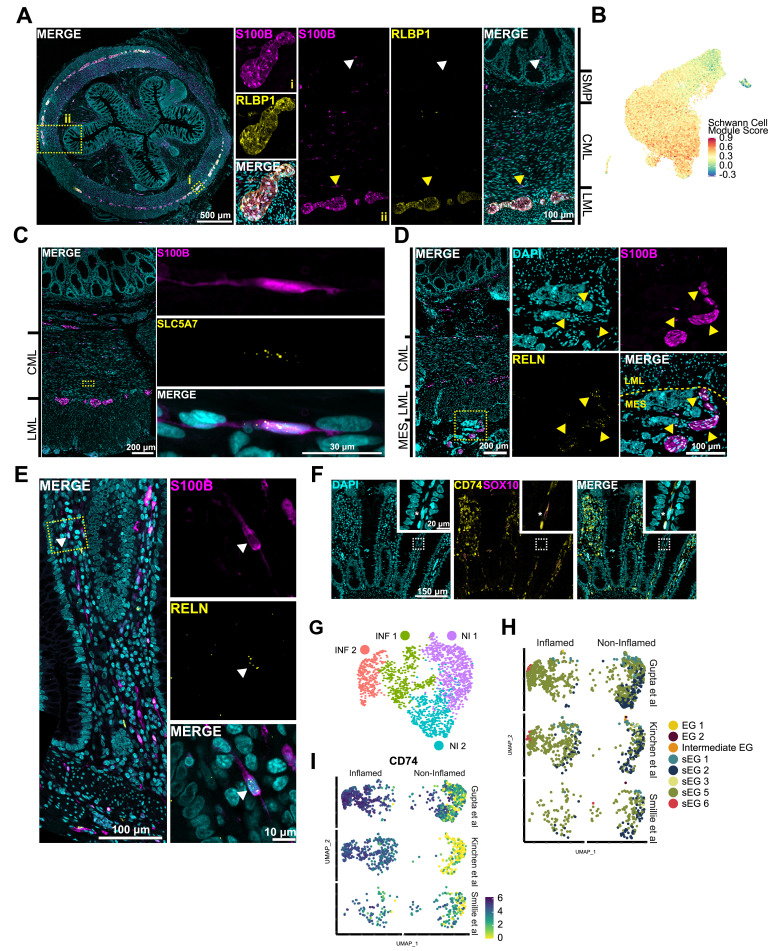
Fig. 2 Enteric glial (EG) clusters align with previously defined morphologic subtypes along the gut–wall axis. (A) Immunohistochemical validation of RLBP1 expression showing colocalization with S100B+ in type I protoplasmic glia located within EG (i). Yellow arrowheads indicate RLBP1+ type I intraganglionic glia (ii). White arrowheads indicate type IIImucosa RLBP1– glia (ii). (B) Uniform manifold approximation and projection (UMAP) visualization showing a computed Schwann module score for all cells in our dataset. Schwann-like enteric glia (sEG) 1–6 have the highest transcriptional resemblance to Schwann cells. (C) FISH combined with immunohistochemistry for S100B shows SLC5A7 expression in bipolar type IV EG. (D) FISH combined with immunohistochemistry for S100B, localizes RELN expression in extrinsic nerve fibers (yellow arrowheads), as well as in (E) type IIImucosa EG adjacent to the epithelium (white arrowhead). (F) FISH combined with immunohistochemistry for S100B, localizes CD74 expression in the lamina propria adjacent to the epithelium. (G) UMAP visualization showing integrated single-cell data from 3 public datasets obtained from mucosal biopsies of patients with inflammatory bowel conditions. (H) UMAP visualization showing single-cell data from 3 public datasets cross-labeled with our pediatric EG classification. (I) Feature plots showing differential expression of CD74 in inflamed and noninflamed tissue. CML, circular muscle layer; DAPI, 4′,6-diamidino-2-phenylindole; INF, inflamed; LML, longitudinal muscle layer; MES, mesentery; NI, noninflamed; SMP, submucosal plexus.