
|
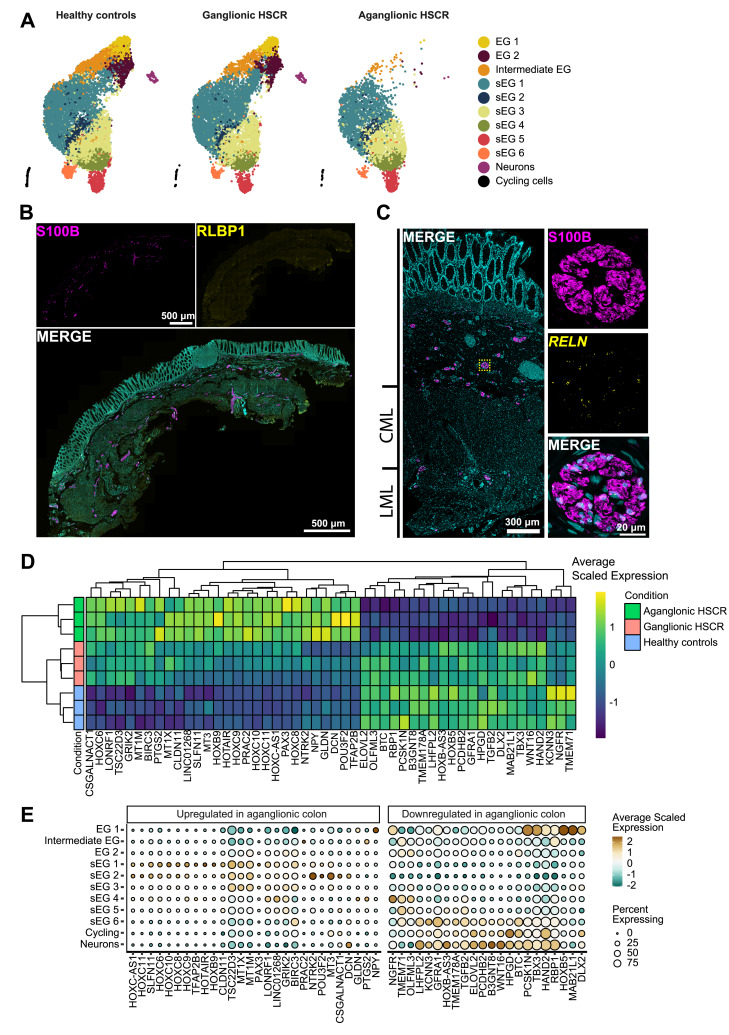
Fig. 4 The molecular landscape of the ENS of individuals with HSCR is dominated by Schwann-like enteric glia (sEG). (A) Uniform manifold approximation and projection (UMAP) visualizations of control, ganglionic, and aganglionic ENS cells. Canonical enteric glia 1–2 (EG 1–2), intermediate EG, and neurons are absent in aganglionic HSCR colon. (B) Immunohistochemistry shows that RLBP1+ glia are absent in aganglionic colon. (C) FISH combined with immunohistochemistry for S100B, localizes RELN expression in glia present in extrinsic hypertrophic nerve fibers in the aganglionic colon. (D) Heat map showing differentially expressed genes stratified by condition. (E) Dot plot showing differential gene expression in aganglionic colon compared with healthy tissue, for each individual cluster. CML, circular muscle layer; LML, longitudinal muscle layer.