
|
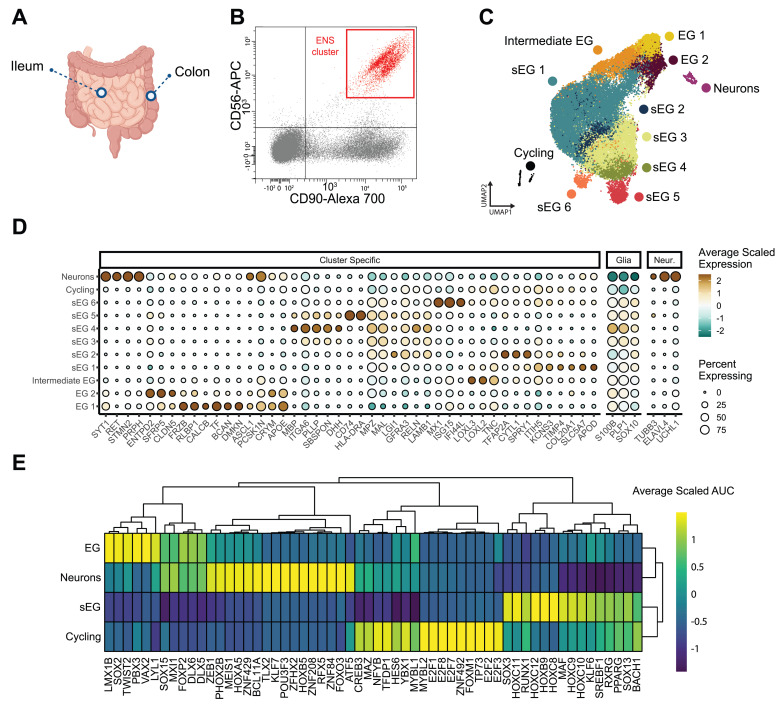
Fig. 1 A single-cell transcriptomic landscape of the pediatric ENS. (A) Schematic of human gut tissue sampling. (B) ENS cells were enriched via CD56+CD90+ in an FACS plot. (C) Uniform manifold approximation and projection visualization showed unsupervised clustering of healthy control ileum and colon ENS cells, indicating the presence of canonical enteric glia 1–2 (EG 1–2) and Schwann-like enteric glia 1–6 (sEG 1–6). (D) Dot plot showing expression of differentially expressed genes across different cell clusters. (E) Heat map showing differentially expressed transcription factors stratified by major classes of captured cells. AUC, area under the curve.