
|
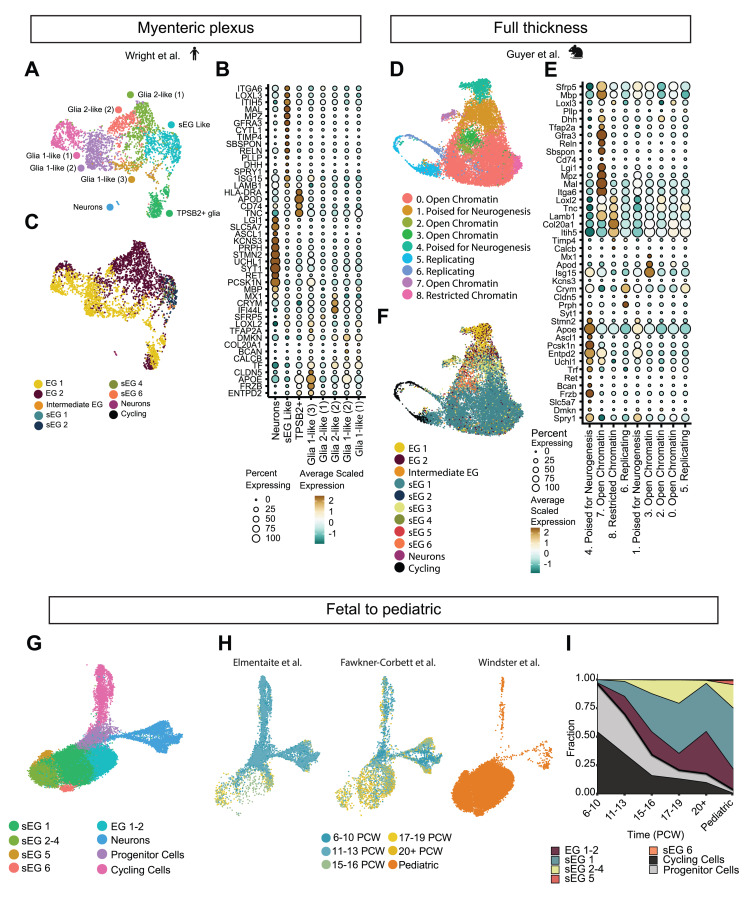
Fig. 3 Integration of the pediatric glial transcriptome across species and time. (A) Uniform manifold approximation and projection (UMAP) visualization showing ENS single-nuclei sequencing data from adult human myenteric plexus. (B) Dot plot showing differentially expressed genes across cell clusters. (C) UMAP visualization showing ENS nuclei cross-labeled with our pediatric enteric glia (EG) classification. (D) UMAP visualization showing ENS scRNA-seq data from full-thickness mouse intestine (P14). (E) Dot plot showing differentially expressed genes across cell clusters. (F) UMAP visualization showing scRNA-seq data from full-thickness P14 mouse tissue cross-labeled with our pediatric EG classification. (G) UMAP visualization showing integration of pediatric and fetal ENS, partially cross-labeled with our pediatric glia annotation. (H) UMAP visualization of each individual dataset colored according to age groups. (I) Proportion plot depicting the relative abundance of glial, cycling, and progenitor clusters across developmental time points. PCW, postconceptual weeks; sEG, Schwann-like enteric glia.