
- Title
-
GPI transamidase complex is required for primordial germ cell migration and development in zebrafish
- Authors
- Zhang, W., Li, Y., Chen, J., Yao, L., Zhang, B., Zhang, L., Liu, B., Shen, W., Meng, A., Wu, X.
- Source
- Full text @ J. Mol. Cell Biol.
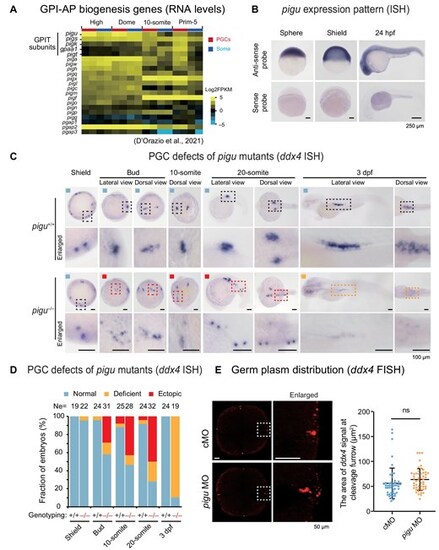
PGC migration defects in tsu419 mutant embryos. (A) Heatmap showing expression levels (D'Orazio et al., 2021) of genes involved in GPI-AP biogenesis, including subunits in the GPIT complex. Soma, somatic cells. (B) ISH of pigu in WT embryos at the sphere, shield, and 24 hpf stages with anti-sense and sense probes, respectively. Scale bar, 250 μm. (C) ddx4 ISH showing PGC locations in pigu+/+ and pigu–/– embryos at the 4-cell, shield, bud, 10-somite, 20-somite, and 3 dpf stages. Scale bar, 100 μm. The dashed boxed areas were enlarged for a better view. Black, red, and orange boxes indicate the region for normal, ectopically located, and deficient ddx4 signal PGCs, respectively. (D) The ratios of embryos in C with normal (blue), ectopically located (red), and deficient ddx4 signal (orange) PGCs. Ne, number of embryos. (E) Left, FISH of ddx4 in control MO (cMO)- and pigu MO-injected embryos at the 4-cell stage, respectively. Scale bar, 50 μm. Right, scatter plot showing the area of ddx4 signals (indicating germ plasm) at cleavage furrow (as shown in left). The numbers of regions detected are 49 in control and 51 in pigu morphants, respectively. ns, not significant, P > 0.1. |
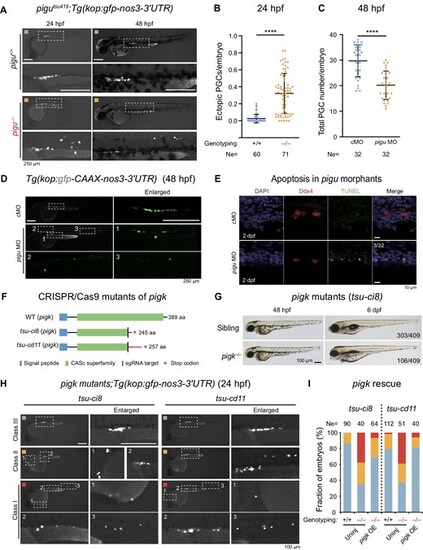
GPIT complex is required for PGC migration. (A) Fluorescence images showing the PGCs in pigu+/+ and pigu–/–embryos by the crossing with Tg(kop:gfp-nos3-3′UTR) transgenic line. The dashed boxed areas were enlarged for better review. Scale bar, 250 μm. (B) Fraction of ectopic PGCs to total PGCs per embryo in embryos in A at 24 hpf. Ne, number of embryos. ****P < 0.0001. (C) Scatter plot showing the total numbers of PGCs per embryo in cMO- and pigu MO-injected embryos at 48 hpf. (D) Fluorescence images showing kop:gfp signals (PGCs) in cMO- and pigu MO-injected embryos at 48 hpf. Scale bar, 250 μm. (E) Fluorescence images showing cMO- and pigu MO-injected embryos at 12-somite and 2 dpf stages with the TUNEL assay (green) and Ddx4 immunostaining (red), respectively. DAPI, DNA, blue. Scale bar, 10 μm. (F) Schematic showing protein structures of WT and two pigk mutant lines, tsu-ci8 and tsu-cd11. (G) Morphology of pigk mutant embryos at 48 hpf and 6 dpf. The ratios of embryos are shown in the picture. Scale bar, 100 μm. (H) Fluorescence images showing the PGCs in pigktsu-ci8 and pigktsu-cd11 embryos by the crossing with Tg(kop:gfp-nos3-3′UTR) transgenic line in class I (red), class II (orange), and class III (blue), which indicate severe and mild defective and normal PGC migration, respectively. The dashed boxed areas were enlarged for better review. Scale bar, 100 μm. (I) The ratios of embryos in class I (red), class II (orange), and class III (blue) in uninjected WT, pigk mutant, and 200 pg WT pigk mRNA-injected pigk mutant embryos. |
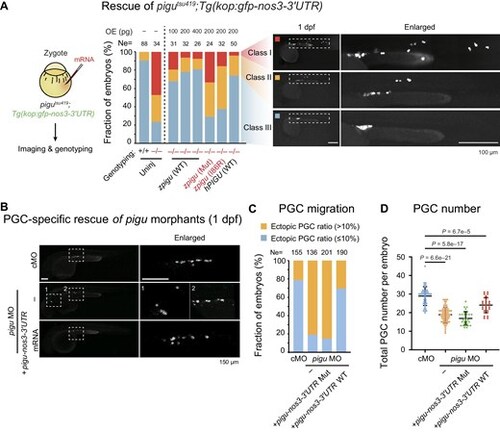
Pigu in somatic cells is involved in PGC migration regulation. (A) Left, schematic showing the strategy of the rescue experiment. Right, bar plot showing the ratios of embryos in classes I, II, and III in the rescue experiment. OE (pg), the dosage of mRNA injection. Representative fluorescence images are shown on the right. (B) Fluorescence images showing signals of PGCs in embryos injected with cMO, pigu MO, or pigu MO and pigu-nos3-3′UTR mRNA at 1 dpf. Scale bar, 150 μm. (C) Bar plot showing the ratios of embryos with normal (blue) and ectopic (orange) PGCs. (D) Scatterplot showing the total numbers of PGCs per embryo in embryos injected with cMO (blue), pigu MO (orange), pigu MO and mutant pigu-nos3-3′UTR mRNA (green), or pigu MO and WT pigu-nos3-3′UTR mRNA (red) at 1 dpf. |
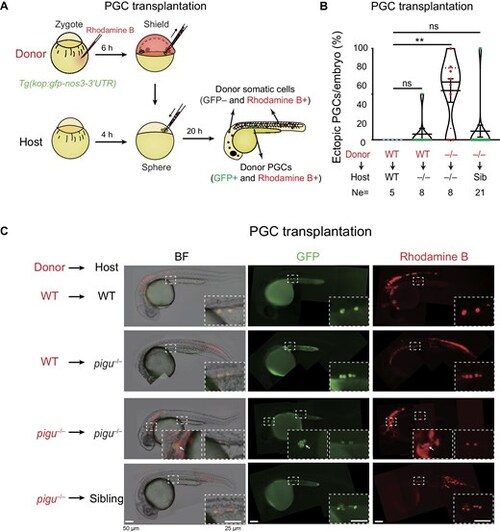
Defective PGC migration in pigu mutants is caused by the loss of Pigu in both PGCs and somatic cells. (A) Schematic showing PGC transplantation. (B) The ratios of ectopic PGCs to total transplanted PGCs per embryo in four PGC transplantation pairs. Ne, the number of transplanted embryos. Sib, sibling. –/–, pigu–/–. **P < 0.01. (C) Fluorescence images showing host embryos with successfully transplanted PGCs. BF, bright field. GFP, labeling PGCs. Rhodamine B, labeling donor cells. The dashed boxed areas were enlarged for better review. The arrows indicate ectopically located PGCs. |
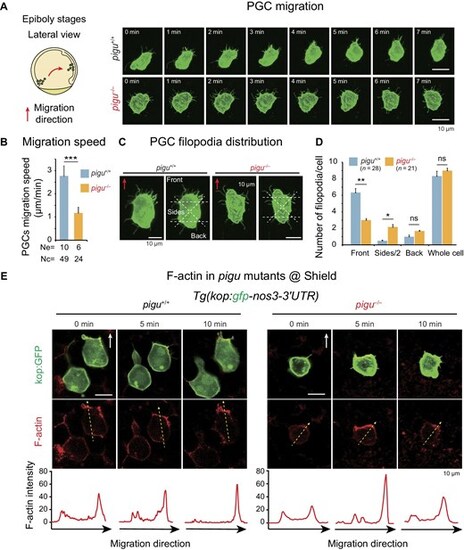
Filopodia dynamics of PGCs in pigu mutants. (A) Left, schematic showing PGC migration in embryos at epiboly stages. The red arrow indicates the PGC migration direction. Right, fluorescence images showing individual pigu+/+ and pigu–/–PGCs during migration at the epiboly stage. Scale bar, 10 μm. (B) Cell migration speed of pigu+/+ and pigu–/– PGCs. Ne, number of embryos. Nc, number of cells. (C) Fluorescence images showing the region classification in statistical analysis of the filopodia distribution in pigu+/+ and pigu–/–PGCs. Red arrow, the orientation of PGC migration. Scale bar, 10 μm. (D) Bar plot showing filopodia distributions in pigu+/+ and pigu–/– PGCs. Data are presented as mean + standard error of the mean. ns, not significant, P > 0.05; *P < 0.05; **P < 0.01. (E) Fluorescence images showing migrating PGCs with GFP labeling (green) and F-actin (red) in pigu+/+ and pigu–/–embryos. White arrow, the orientation of PGC migration. Scale bar, 20 μm. The curve plots below showing the quantitative of F-actin signals. |
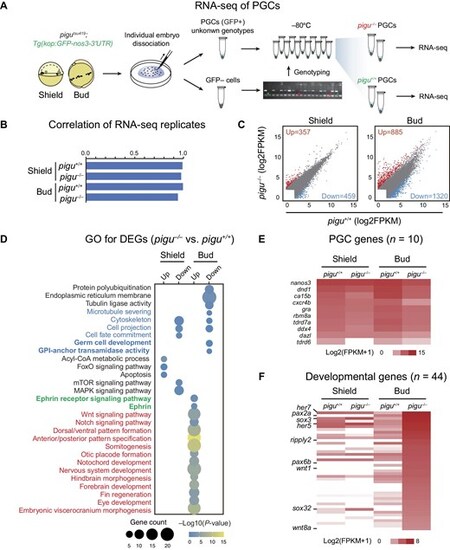
Transcriptome analysis of PGCs in WT and pigu mutant embryos. (A) Schematic showing sample collection for RNA-seq of PGCs. (B) Correlations between replicates of pigu+/+ and pigu–/–PGCs at the shield and bud stages. (C) Differentially expressed genes (DEGs) between pigu+/+ and pigu–/–PGCs at the shield and bud stages. Red, upregulated genes. Blue, downregulated genes. (D) GO analysis of DEGs from pigu–/–vs. pigu+/+ PGCs. (E and F) PGC-specific gene (E) and developmental gene (F) expression levels in pigu+/+ (blue) and pigu–/–(red) PGCs at the shield and bud stages. |