
Image
|
Figure Caption
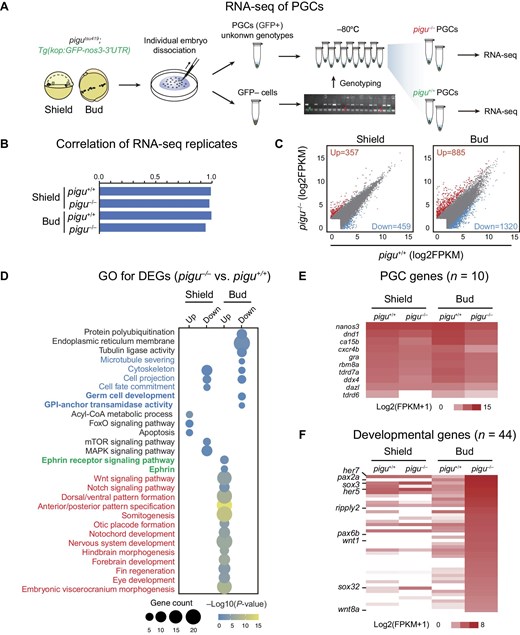
Fig. 6 Transcriptome analysis of PGCs in WT and pigu mutant embryos. (A) Schematic showing sample collection for RNA-seq of PGCs. (B) Correlations between replicates of pigu+/+ and pigu–/–PGCs at the shield and bud stages. (C) Differentially expressed genes (DEGs) between pigu+/+ and pigu–/–PGCs at the shield and bud stages. Red, upregulated genes. Blue, downregulated genes. (D) GO analysis of DEGs from pigu–/–vs. pigu+/+ PGCs. (E and F) PGC-specific gene (E) and developmental gene (F) expression levels in pigu+/+ (blue) and pigu–/–(red) PGCs at the shield and bud stages.
Acknowledgments
This image is the copyrighted work of the attributed author or publisher, and
ZFIN has permission only to display this image to its users.
Additional permissions should be obtained from the applicable author or publisher of the image.
Full text @ J. Mol. Cell Biol.