
Fig. 5
- ID
- ZDB-FIG-250710-70
- Publication
- Zhang et al., 2024 - GPI transamidase complex is required for primordial germ cell migration and development in zebrafish
- Other Figures
- All Figure Page
- Back to All Figure Page
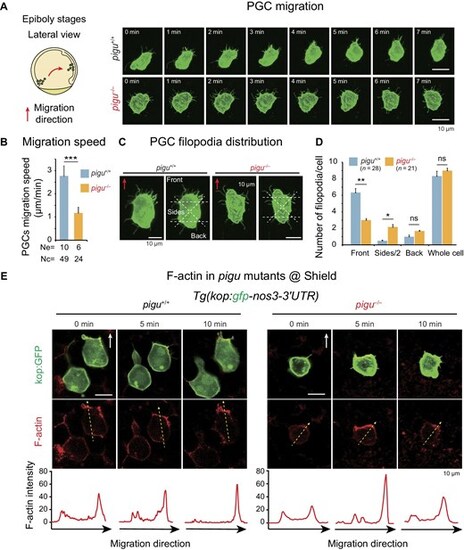
Filopodia dynamics of PGCs in pigu mutants. (A) Left, schematic showing PGC migration in embryos at epiboly stages. The red arrow indicates the PGC migration direction. Right, fluorescence images showing individual pigu+/+ and pigu–/–PGCs during migration at the epiboly stage. Scale bar, 10 μm. (B) Cell migration speed of pigu+/+ and pigu–/– PGCs. Ne, number of embryos. Nc, number of cells. (C) Fluorescence images showing the region classification in statistical analysis of the filopodia distribution in pigu+/+ and pigu–/–PGCs. Red arrow, the orientation of PGC migration. Scale bar, 10 μm. (D) Bar plot showing filopodia distributions in pigu+/+ and pigu–/– PGCs. Data are presented as mean + standard error of the mean. ns, not significant, P > 0.05; *P < 0.05; **P < 0.01. (E) Fluorescence images showing migrating PGCs with GFP labeling (green) and F-actin (red) in pigu+/+ and pigu–/–embryos. White arrow, the orientation of PGC migration. Scale bar, 20 μm. The curve plots below showing the quantitative of F-actin signals. |