
|
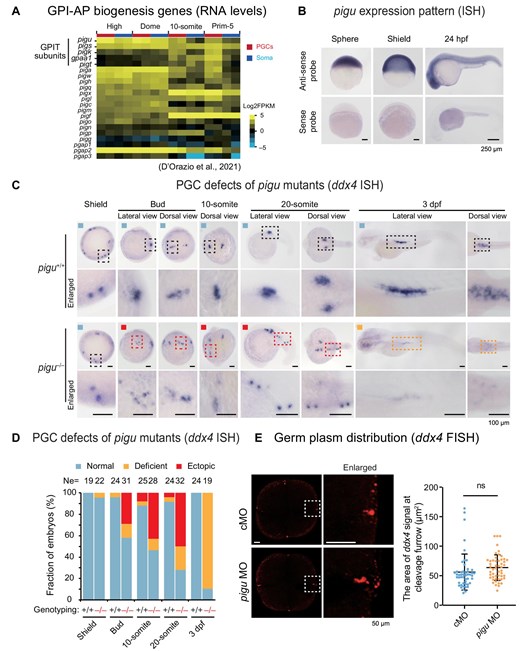
Fig. 1 PGC migration defects in tsu419 mutant embryos. (A) Heatmap showing expression levels (D'Orazio et al., 2021) of genes involved in GPI-AP biogenesis, including subunits in the GPIT complex. Soma, somatic cells. (B) ISH of pigu in WT embryos at the sphere, shield, and 24 hpf stages with anti-sense and sense probes, respectively. Scale bar, 250 μm. (C) ddx4 ISH showing PGC locations in pigu+/+ and pigu–/– embryos at the 4-cell, shield, bud, 10-somite, 20-somite, and 3 dpf stages. Scale bar, 100 μm. The dashed boxed areas were enlarged for a better view. Black, red, and orange boxes indicate the region for normal, ectopically located, and deficient ddx4 signal PGCs, respectively. (D) The ratios of embryos in C with normal (blue), ectopically located (red), and deficient ddx4 signal (orange) PGCs. Ne, number of embryos. (E) Left, FISH of ddx4 in control MO (cMO)- and pigu MO-injected embryos at the 4-cell stage, respectively. Scale bar, 50 μm. Right, scatter plot showing the area of ddx4 signals (indicating germ plasm) at cleavage furrow (as shown in left). The numbers of regions detected are 49 in control and 51 in pigu morphants, respectively. ns, not significant, P > 0.1.