
|
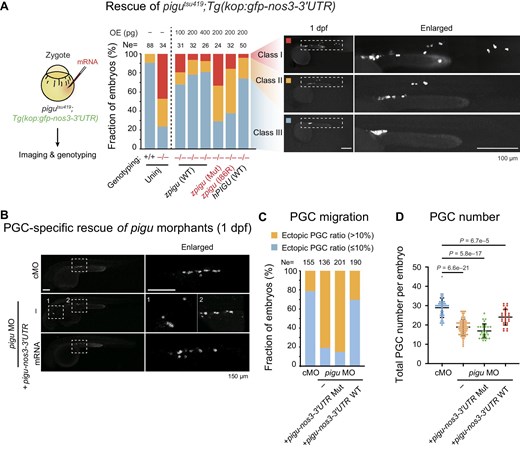
Fig. 3 Pigu in somatic cells is involved in PGC migration regulation. (A) Left, schematic showing the strategy of the rescue experiment. Right, bar plot showing the ratios of embryos in classes I, II, and III in the rescue experiment. OE (pg), the dosage of mRNA injection. Representative fluorescence images are shown on the right. (B) Fluorescence images showing signals of PGCs in embryos injected with cMO, pigu MO, or pigu MO and pigu-nos3-3′UTR mRNA at 1 dpf. Scale bar, 150 μm. (C) Bar plot showing the ratios of embryos with normal (blue) and ectopic (orange) PGCs. (D) Scatterplot showing the total numbers of PGCs per embryo in embryos injected with cMO (blue), pigu MO (orange), pigu MO and mutant pigu-nos3-3′UTR mRNA (green), or pigu MO and WT pigu-nos3-3′UTR mRNA (red) at 1 dpf.