
- Title
-
Myosin 1b regulates intestinal epithelial morphogenesis via interaction with UNC45A
- Authors
- Revenu, C., Lebreton, C., Cannata Serio, M., Rosello, M., Duclaux-Loras, R., Duroure, K., Nicolle, O., Eggeler, F., Prospéri, M.T., Stoufflet, J., Vougny, J., Lépine, P., Michaux, G., Cerf-Bensussan, N., Coudrier, E., Perez, F., Parlato, M., Del Bene, F.
- Source
- Full text @ Cell Rep.
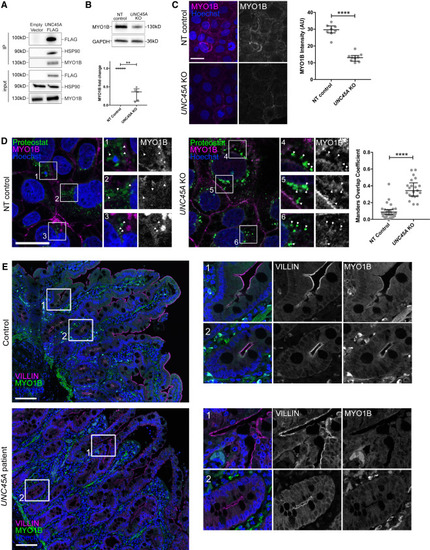
MYO1B interacts with UNC45A and is misfolded in UNC45A-depleted cells and in biopsies from UNC45A-deficient patient (A) Coimmunoprecipitation of UNC45A with MYO1b and HSP90 in Caco-2 cells transduced with empty vector (EV) or FLAG/MYC-UNC45A. (B) Western blot analysis of UNC45A Caco-2 KO cells and NT control lysates using anti-MYO1b antibody and relative quantification (n = 5). (C) Immunohistochemistry analyses and quantification of MYO1b intensity in NT control (n = 8) and UNC45A KO (n = 9) Caco-2 cells. Pictures are maximal projections of confocal stacks; Hoechst labels nuclei. Scale bar, 30 μm. (D) Confocal sections of NT control and UNC45A KO Caco-2 cells treated with the proteasome inhibitor MG132 and stained for MYO1b and with the aggresome probe Proteostat and quantification of the colocalization (NT n = 32; KO n = 21). Hoechst labels nuclei. Scale bar, 30 μm. Boxed areas shown in insets are enlarged 2×. Arrowheads point at Proteostat-labeled protein aggregates and highlight colocalization with MYO1B proteins in UNC45A KO cells. (E) Confocal sections of a human biopsy from a control and from a UNC45A LOF patient immunolabeled for the microvilli marker Villin and for MYO1b; Hoechst labels nuclei. Scale bar, 100 μm. Boxed areas shown in insets are enlarged 3× and highlight the apical localization of MYO1b in duodenal control tissue at the base of the villi (1) and in crypts (2). Data presented in (B), (C), and (D) are shown as median and interquartile range; Mann-Whitney test ∗∗p < 0.01, ∗∗∗∗p < 0.0001. |
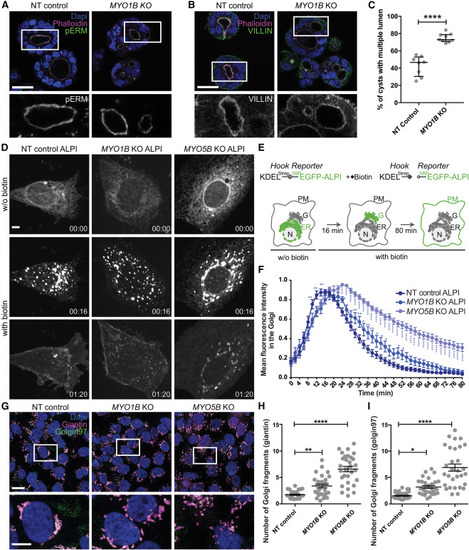
MYO1B loss impairs enterocyte 3D organization and trafficking despite normal apicobasal polarization (A and B) Confocal sections of NT control and MYO1B KO Caco-2 3D cultures stained for the apical and microvilli markers phospho-Ezrin (pERM, A) and Villin (B). F-actin (phalloidin) and nuclei (DAPI) are stained. Scale bars, 30 μm. Boxed areas shown in insets are enlarged 2.5×. (C) Quantification of the percentage of well-formed cysts with a single central lumen in NT control and MYO1B KO Caco-2 3D cultures. In total, 115 cysts from eight fields (NT) and 379 cysts from nine fields (KO) were analyzed. Data are presented as median and interquartile range; Mann-Whitney ∗∗∗∗p < 0.0001. (D) Imaging of the synchronized transport of stably expressed SBP-EGFP-ALPI (intestinal alkaline phosphatase) in Caco-2 NT, MYO1B KO, and MYO5B KO cells. Streptavidin-KDEL was used as an ER hook. Release from the ER was induced by addition of biotin at 0 min. Scale bar, 50 μm. (E) Schematics of the RUSH assay. PM, plasma membrane; ER, endoplasmic reticulum; G, Golgi; N, nucleus. (F) Kinetics of arrival of ALPI in Caco-2 NT, MYO1B KO, and MYO5B KO (color) cells to the cell surface after release from the ER. See also Videos S1, S2, and S3. Caco-2 NT n = 30, MYO1B KO n = 26, MYO5B KO n = 22, two-way ANOVA followed by a Bonferroni multiple comparison test. ns, not significant; ∗p < 0.5, ∗∗∗p < 0.001, ∗∗∗∗p < 0.0001. (G) Confocal sections of NT control, MYO1B KO, and MYO5B KO Caco-2 cells stained for the cis- and medial-Golgi marker giantin, the trans-Golgi network marker golgin97, the cis- and medial-Golgi marker giantin, and nuclei (DAPI). Scale bar, 20 μm. Insets are provided as white boxes for better visualization (scale bar, 10 μm). (H and I) Quantification of the Golgi fragmentation was determined using deconvolved images to sharpen the distinction between Golgi apparatus and general cytosplasmic fluorescence. Deconvolved images were then segmented based on the intensity of the giantin fluorescence (H) and golgin97 (I), and the number of Golgi fragments was determined using Imaris software. Thirty cells were analyzed for each data point. Data are shown as median ± SEM. Caco-2 NT n = 30, MYO1B KO n = 30, MYO5B KO n = 30; ordinary one-way ANOVA followed by a Bonferroni multiple comparisons test. ∗p < 0.05, ∗∗p < 0.01, ∗∗∗∗p < 0.0001. |
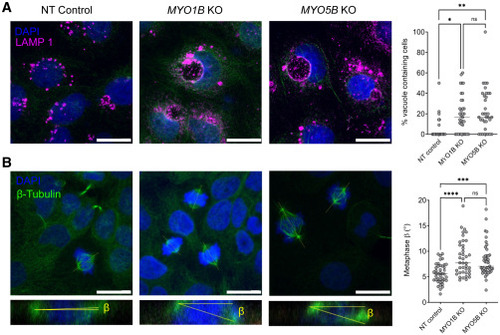
MYO1B loss impairs membrane recycling and spindle orientation (A) Confocal sections of NT control, MYO1B KO, and MYO5B KO Caco-2 3D cultures stained for the lysosome marker LAMP1 and DAPI, and quantification of the percentage of vacuoles containing cells (Caco-2 NT n = 22, MYO1B KO n = 35, MYO5B KO n = 35). Scale bars, 20 μm. (B) Confocal sections of NT control and MYO1B KO Caco-2 3D cultures stained for β-tubulin and DAPI. The β angle between the spindle axis and the substratum in the confocal x-z dimension was quantified in metaphase (Caco-2 NT n = 42, MYO1B KO n = 40, MYO5B KO n = 44). Scale bars, 20 μm. Data are presented as median; one-way ANOVA test, ∗p < 0.05, ∗∗p < 0.01, ∗∗∗p < 0.001, ∗∗∗∗p < 0.0001. |

Myo1b localizes apically in the zebrafish gut epithelium but is not involved in epithelial cell differentiation (A) Phylogenetic tree based on protein sequence of zebrafish, chick, human, and mouse Myo1b and Myo1a and Drosophila Myo95E. (B) In situ hybridization for myo1b transcripts on 3- and 5-dpf zebrafish larvae whole mounts (left panels) and cross-sections at the level of the intestinal bulb (right panels). On sections, the forming intestinal bulb is circled with white dashed lines. (C) Live, longitudinal (anteroposterior axis) confocal section of the intestinal bulb of a 5-dpf zebrafish larva expressing the transcription activator KalT4 driving the expression of the eGFP-Myo1b transgene under the control of an upstream activating sequence in the gut epithelium. Scale bar, 30 μm. (D) Confocal imaging of zebrafish section sections stained with DAPI of 5-dpf larvae injected with control and Myo1b MO, and 5-dpf WT and myo1b−/− larvae. ib, intestinal bulb (circled with dashed lines); m, muscles; n, notochord; nt, neural tube; sb, swim bladder; y, yolk. Scale bar, 100 μm. (E) Quantifications from DAPI-stained sections of the total number of cells per section at 3 and 5 dpf in the four conditions. Data are presented as median and interquartile range; Mann-Whitney test, ∗p < 0.05, ∗∗∗p < 0.001. (F) Imaging of zebrafish larval sections of the intestinal bulb at 5 dpf in the four conditions stained for the microvilli marker Villin, F-actin (phalloidin), and DAPI. Scale bar, 20 μm. EXPRESSION / LABELING:
PHENOTYPE:
|
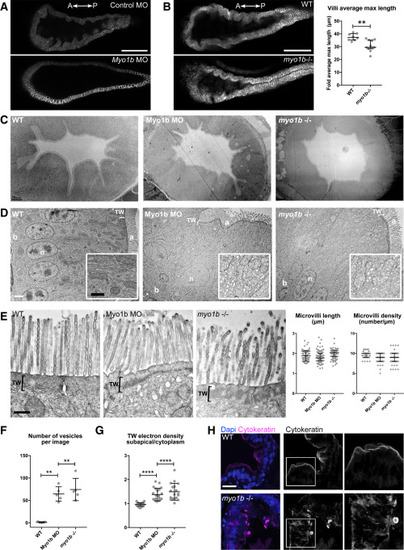
Loss of Myo1b causes villus atrophy-like features in the intestinal bulb epithelium in zebrafish (A) Single confocal plane of live 5-dpf larvae expressing Cldn15la-GFP injected with control MO (top) and Myo1b-MO (bottom). Note the flat epithelium in the Myo1b MO condition. Scale bar, 100 μm. (B) (Left) Single confocal planes of live 5-dpf WT (top) and myo1b−/− (bottom) larvae expressing Cldn15la-GFP. Scale bar, 100 μm. (Right) Quantification of the average length of the three longest folds per intestinal bulb analyzed. Data are presented as median and interquartile range (WT n = 8, myo1b−/− n = 11); Mann-Whitney test, ∗∗p < 0.01. (C and D) Transmission electron micrographs of sections of intestinal bulbs from WT, Myo1b MO, and myo1b−/− 5-dpf larvae presenting a general view of the folds of the epithelium (C; scale bar, 10 μm) and of the apicobasally polarized enterocytes (D; b, basal; a, apical; n, nuclei; scale bar, 2 μm). Insets in (D) show higher magnifications of the cytoplasm region (scale bar, 1 μm). (E) Transmission electron micrographs of sections of intestinal bulbs from WT, Myo1b MO, and myo1b−/− 5dpf larvae illustrating the organization of the brush border. Scale bar, 500 nm. Quantifications of the average length and density of the intestinal microvilli in the different conditions (n = 75). Data presented are median and interquartile range. (F and G) Quantification of vesicles (n = 5) (F) and TW electron density subapical/cytoplasm (G; WT n = 27, MO n = 21, myo1b−/− n = 18). Data are presented as median and interquartile range; Mann-Whitney test, ∗∗p < 0.01, ∗∗∗∗p < 0.0001. (H) Imaging of sections of the intestinal bulb of WT and myo1b−/− 5-dpf larvae stained for the intermediate filament marker cytokeratin and DAPI. Scale bar, 20 μm. |