
Fig. 2
- ID
- ZDB-FIG-250128-63
- Publication
- Revenu et al., 2024 - Myosin 1b regulates intestinal epithelial morphogenesis via interaction with UNC45A
- Other Figures
- All Figure Page
- Back to All Figure Page
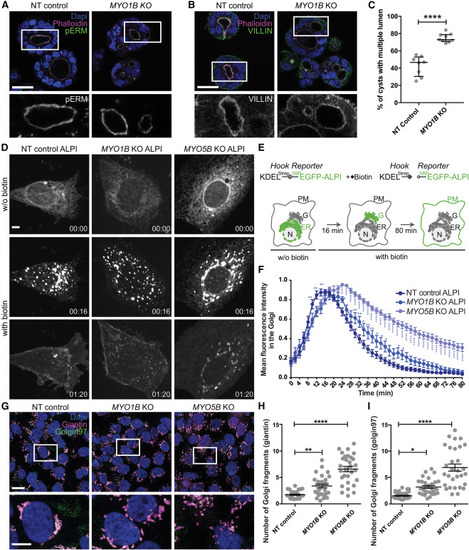
MYO1B loss impairs enterocyte 3D organization and trafficking despite normal apicobasal polarization (A and B) Confocal sections of NT control and MYO1B KO Caco-2 3D cultures stained for the apical and microvilli markers phospho-Ezrin (pERM, A) and Villin (B). F-actin (phalloidin) and nuclei (DAPI) are stained. Scale bars, 30 μm. Boxed areas shown in insets are enlarged 2.5×. (C) Quantification of the percentage of well-formed cysts with a single central lumen in NT control and MYO1B KO Caco-2 3D cultures. In total, 115 cysts from eight fields (NT) and 379 cysts from nine fields (KO) were analyzed. Data are presented as median and interquartile range; Mann-Whitney ∗∗∗∗p < 0.0001. (D) Imaging of the synchronized transport of stably expressed SBP-EGFP-ALPI (intestinal alkaline phosphatase) in Caco-2 NT, MYO1B KO, and MYO5B KO cells. Streptavidin-KDEL was used as an ER hook. Release from the ER was induced by addition of biotin at 0 min. Scale bar, 50 μm. (E) Schematics of the RUSH assay. PM, plasma membrane; ER, endoplasmic reticulum; G, Golgi; N, nucleus. (F) Kinetics of arrival of ALPI in Caco-2 NT, MYO1B KO, and MYO5B KO (color) cells to the cell surface after release from the ER. See also Videos S1, S2, and S3. Caco-2 NT n = 30, MYO1B KO n = 26, MYO5B KO n = 22, two-way ANOVA followed by a Bonferroni multiple comparison test. ns, not significant; ∗p < 0.5, ∗∗∗p < 0.001, ∗∗∗∗p < 0.0001. (G) Confocal sections of NT control, MYO1B KO, and MYO5B KO Caco-2 cells stained for the cis- and medial-Golgi marker giantin, the trans-Golgi network marker golgin97, the cis- and medial-Golgi marker giantin, and nuclei (DAPI). Scale bar, 20 μm. Insets are provided as white boxes for better visualization (scale bar, 10 μm). (H and I) Quantification of the Golgi fragmentation was determined using deconvolved images to sharpen the distinction between Golgi apparatus and general cytosplasmic fluorescence. Deconvolved images were then segmented based on the intensity of the giantin fluorescence (H) and golgin97 (I), and the number of Golgi fragments was determined using Imaris software. Thirty cells were analyzed for each data point. Data are shown as median ± SEM. Caco-2 NT n = 30, MYO1B KO n = 30, MYO5B KO n = 30; ordinary one-way ANOVA followed by a Bonferroni multiple comparisons test. ∗p < 0.05, ∗∗p < 0.01, ∗∗∗∗p < 0.0001. |