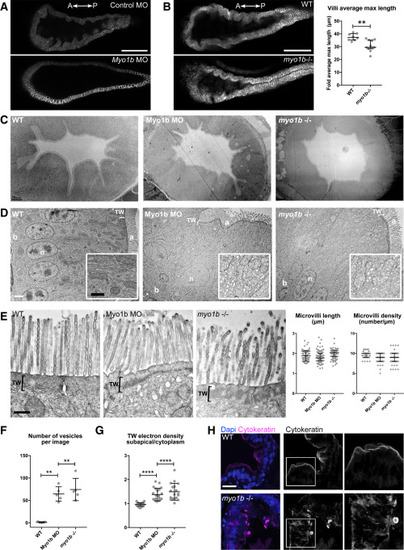
Loss of Myo1b causes villus atrophy-like features in the intestinal bulb epithelium in zebrafish (A) Single confocal plane of live 5-dpf larvae expressing Cldn15la-GFP injected with control MO (top) and Myo1b-MO (bottom). Note the flat epithelium in the Myo1b MO condition. Scale bar, 100 μm. (B) (Left) Single confocal planes of live 5-dpf WT (top) and myo1b−/− (bottom) larvae expressing Cldn15la-GFP. Scale bar, 100 μm. (Right) Quantification of the average length of the three longest folds per intestinal bulb analyzed. Data are presented as median and interquartile range (WT n = 8, myo1b−/− n = 11); Mann-Whitney test, ∗∗p < 0.01. (C and D) Transmission electron micrographs of sections of intestinal bulbs from WT, Myo1b MO, and myo1b−/− 5-dpf larvae presenting a general view of the folds of the epithelium (C; scale bar, 10 μm) and of the apicobasally polarized enterocytes (D; b, basal; a, apical; n, nuclei; scale bar, 2 μm). Insets in (D) show higher magnifications of the cytoplasm region (scale bar, 1 μm). (E) Transmission electron micrographs of sections of intestinal bulbs from WT, Myo1b MO, and myo1b−/− 5dpf larvae illustrating the organization of the brush border. Scale bar, 500 nm. Quantifications of the average length and density of the intestinal microvilli in the different conditions (n = 75). Data presented are median and interquartile range. (F and G) Quantification of vesicles (n = 5) (F) and TW electron density subapical/cytoplasm (G; WT n = 27, MO n = 21, myo1b−/− n = 18). Data are presented as median and interquartile range; Mann-Whitney test, ∗∗p < 0.01, ∗∗∗∗p < 0.0001. (H) Imaging of sections of the intestinal bulb of WT and myo1b−/− 5-dpf larvae stained for the intermediate filament marker cytokeratin and DAPI. Scale bar, 20 μm.
|
