FIGURE SUMMARY
Title

EFEMP1 contributes to light-dependent ocular growth in zebrafish

Authors
Xie, J., Bui, B.V., Goodbourn, P.T., Jusuf, P.R.
Source
Full text @ Biol. Open

Genotypic details of retina-specific efemp1-modified mutants (efemp12C-Cas9) and phenotypic verification via optomotor responses at 5 days post-fertilization (dpf). (A) The efemp12C-Cas9 fish were generated using 2C-Cas9 somatic gene editing. Mutant fish have three separate transgenes: Tg(rx2:Gal4)×Tg(bact2-loxP-mCherry-loxP-eGFP)×Tg(UAS:Cas9T2ACre;U6:efemp1sgRNA1;U6:efemp1sgRNA2). Co-expression of these transgenic elements result in expression of green fluorescence (eGFP) in zebrafish retina, indicative of successful Cas9 protein expression. (A′) Representative retinal image from a 6 dpf fish. Nuclei stained with DAPI are shown in grey. INL, inner nuclear layer; IPL, inner plexiform layer; GCL, ganglion cell layer. Scale bar: 40 μm. (B) The universally expressed efemp1 sgRNA1 and sgRNA2 from the transgene binds with Cas9 nucleases and cuts exons 3 and 5 of the efemp1 genome DNA (gDNA), respectively. Standard PCR primers used for genotyping the target sites 1 and 2 amplified 525- (Product 1, P1; spinning from the introns before to after the exon 3) and 471-base pairs (bp; P2; spinning from the intron before to the end of exon 5) of DNA sequences, respectively. Products of headloop PCR are 23-bp longer for P1 and 20-bp longer for P2 due to the headloop tags in reverse primers. UTR, untranslated region. (C,D) Gel electrophoresis of the products from standard and headloop PCR for genotyping targeted sites 1 (C) and 2 (D). In both images, the middle lanes show a 100-bp reference ladder; positions of 300 and 500 bp of size are indicated for both gel images. (E–H) Results of optomotor responses. Spatial-frequency tuning functions (E) for 5 dpf efemp1+/+ (n=14) and efemp12C-Cas9 fish (n=13) are three-parameter log-Gaussian functions fit to the data by minimizing the least-square error. The fitted parameters, including (F) normalized amplitude, (G) peak frequency and (H) bandwidth, were compared between groups. Group data are shown as mean±s.e.m. in E and mean with 95% confidence intervals in F–H. *P<0.05 (F-test).

Ocular development of efemp12C-Cas9 fish under normal rearing. (A) Representative optical coherence tomography (OCT) image showing eye components, including the cornea, iris, lens, retina and retinal pigment epithelium (RPE). Relative ocular refraction was calculated as the ratio of retinal radius to lens radius. (B) Ocular refraction of efemp1+/+ and efemp12C-Cas9 fish at 5 days post-fertilization (dpf; n=30 and 29 eyes, respectively), and 2 (n=40 per genotype), 4 (n=40 and 38 eyes, respectively), 6 (n=39 and 40 eyes, respectively), and 8 weeks post-fertilization (wpf; n=40 and 34 eyes, respectively). Group data are shown as mean±s.e.m. (C) efemp12C-Cas9 fish were categorized into two groups based on their retinal eGFP levels (eGFP+ versus eGFP+++). Sporadic eGFP positive cells (highlighted by yellow arrows) are evident in the eGFP+ retinal image, whereas the eGFP+++ retinal image had more EGFP cells. Scale bar: 40 μm. Survival rates for eGFP+ and eGFP+++ groups from 5 days (d; set as 100%) to 8 weeks (w) of age are presented as mean±s.e.m. Three tanks per group were analyzed. *P<0.05; **P<0.01; ****P<0.0001. Two-way ANOVA and Fisher's LSD post-hoc tests were performed. In C, for comparisons within each eGFP level, only significant survival differences between a time point and its adjacent time are shown. (D–I) Representative images of eye morphology for efemp1+/+ (D,E) and efemp12C-Cas9 fish (F–I) reared under normal lighting at 1 years old. Yellow arrowheads indicate enlarged eyes. Dashed region below the eye in H highlights a scleral crack shown in the zoom-in image insert, in which the yellow dashed line indicates the estimated normal position of the posterior eye of zebrafish. Scale bars: 3 mm.

Electroretinogram (ERG) results of efemp1+/+ and efemp12C-Cas9 fish under normal rearing. (A,B,C,D) Group average ERG traces with shades areas indicating SEM, (A1,B1,C1,D1) b-wave amplitudes, (A2,B2,C2,D2) a-wave amplitudes, (A3,B3,C3,D3) b-wave implicit times and (A4,B4,C4,D4) a-wave implicit times at 2 (A–A4, respectively), 4 (B–B4, respectively), 6 (C–C4, respectively) and 8 (D–D4, respectively) weeks post-fertilization (wpf). There were 14 and 11 eyes for 2 wpf, 13 and 12 eyes for 4 wpf, 20 and 17 eyes for 6 wpf, and 17 and 16 eyes for 8 wpf efemp1+/+ and efemp12C-Cas9 fish, respectively. Scale bars: 300 µV in A and B and 100 µV in C and D. Group data are shown as mean±s.e.m. Two-way ANOVA and Fisher's LSD post-hoc tests were performed. *P<0.05; **P<0.01; ***P<0.001; ****P<0.0001.

Ocular refraction of efemp1+/+ and efemp12C-Cas9 fish after environmental treatment. (A) Efemp1+/+ and efemp12C-Cas9 fish were reared under normal light/dark cycle (L/D) until 4 weeks post-fertilization (wpf) and either continued under normal lighting (L/D) or switched to dark-rearing (D/D) for 2 or 4 weeks (to 6 or 8 wpf, respectively). (B) Relative ocular refraction of L/D- or D/D-reared efemp1+/+ and efemp12C-Cas9 eyes were quantified after 2 or 4 weeks of treatment using optical coherence tomography (OCT). There were 39, 40, 42 and 40 eyes at the 2-week time point, and 40, 34, 40 and 40 eyes at the 4-week time point for L/D-reared efemp1+/+, L/D-reared efemp12C-Cas9, D/D-reared efemp1+/+, D/D-reared efemp12C-Cas9 fish, respectively. Group data are shown as mean±s.e.m. Three-way ANOVA and Fisher's LSD post-hoc analyses were performed. *P<0.05; **P<0.01; ***P<0.001; ****P<0.0001.

Electroretinography (ERG) of efemp1+/+ and efemp12C-Cas9 fish after 2 days, 2 weeks or 4 weeks of L/D or D/D rearing. (A–H) Group average ERG traces for (A) L/D-reared efemp1+/+ (n=12), (B) L/D-reared efemp12C-Cas9 (n=13), (C) D/D-reared efemp1+/+ (n=13) and (D) D/D-reared efemp12C-Cas9 eyes (n=14). Shaded areas indicated SEM. Group (E) b-wave amplitude, (F) a-wave amplitude, (G) b-wave implicit time and (H) a-wave implicit times measured after 2 days of treatment. Vertical scale bar indicates 100 µV and horizontal scale bar represents 100 ms in A–D. (I–P) Group average ERG traces for (I) L/D-reared efemp1+/+ (n=14), (J) L/D-reared efemp12C-Cas9 (n=15), (K) D/D-reared efemp1+/+ (n=16) and (L) D/D-reared efemp12C-Cas9 eyes (n=15), as well as their (M) b-wave amplitude, (N) a-wave amplitude, (O) b-wave implicit time and (P) a-wave implicit time measured after 2 weeks of treatment. (Q–X) Group average ERG traces for (Q) L/D-reared efemp1+/+ (n=15), (R) L/D-reared efemp12C-Cas9 (n=16), (S) D/D-reared efemp1+/+ (n=16) and (T) D/D-reared efemp12C-Cas9 eyes (n=14), as well as their (U) b-wave amplitude, (V) a-wave amplitude, (W) b-wave implicit time and (X) a-wave implicit time measured after 4 weeks of treatment. Group data are shown as mean±s.e.m. ERGs were measured at −0.83, 0.73 and 1.87 log cd.s.m-2 of stimulus intensities, represented by black blocks of different sizes below graphs; thicker blocks indicate higher intensities. Three-way ANOVA and Fisher's LSD post-hoc tests were performed. Significant main effects of genotypes (G) and interactions between genotypes and rearing conditions (G×E) are indicated in the graphs. *P<0.05; **P<0.01; ***P<0.001; ****P<0.0001.

Expression of representative myopia-associated genes for efemp1+/+ and efemp12C-Cas9 fish after 2 days or 4 weeks of L/D or D/D rearing. (A) efemp1+/+ and efemp12C-Cas9 fish were reared under a standard L/D to 4 wpf and then were reared under L/D or D/D to up to 8 wpf (4 weeks of treatment). Eyes for molecular analysis were sampled after 2 days or 4 weeks of treatment. Relative mRNA levels of myopia-associated genes, including (B) efemp1, (C) egr1, (D) tgfb1a, (E) tgfb1b, (F) vegfaa, (G) vegfab, (H) igf1, (I) fgf2, (J) wnt2b, (K) rbp3, (L) gjd2a, (M) and gjd2b were analyzed for efemp1+/+ and efemp12C-Cas9 fish after 2 days and 4 weeks of treatment (n=4 samples per group), using RT-qPCR. Group data are shown as mean±s.e.m. Three-way ANOVA and Fisher's LSD post-hoc tests were performed. Significant main effects of genotypes (G), rearing conditions (E) and their interactions (G×E) are indicated in the graphs. *P<0.05; **P<0.01; ***P<0.001; ****P<0.0001.

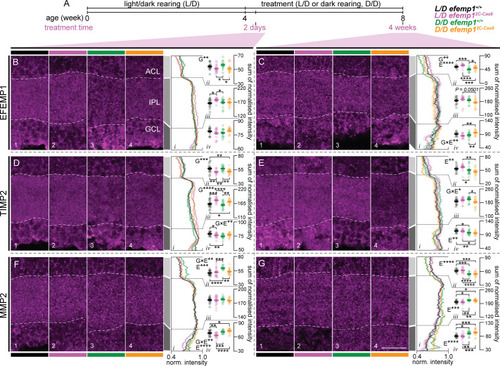
Distribution of EFEMP1, TIMP2 and MMP2 in the inner retina of efemp1+/+ and efemp12C-Cas9 fish after 2 days or 4 weeks of normal L/D cycle or D/D rearing. (A) efemp1+/+ and efemp12C-Cas9 fish were reared under standard L/D condition to 4 wpf and then were under L/D- or D/D-rearing to up to 8 wpf (4 weeks of treatment). Eyes for histological analysis were sampled after 2 days or 4 weeks of treatment. (B,C) Immunostaining for EFEMP1 to analyze its distribution in the inner retina, including amacrine cell layer (ACL), inner plexiform layer (IPL) and ganglion cell layer (GCL), for L/D-reared efemp1+/+, L/D-reared efemp12C-Cas9, D/D-reared efemp1+/+ and D/D-reared efemp12C-Cas9 fish after 2 days (B; n=16, 16, 14 and 14 retinae, respectively) and 4 weeks (C; n=12, 12, 15 and 14 retinae, respectively) of treatment. White dashed lines in micrographs highlight the borders of the IPL. Average normalized expression across the inner retina is shown in Bi and Ci and summed normalized expression (normalized intensity) for (Bii and Cii) ACL, (Biii and Ciii) IPL and (Biv and Civ) GCL was quantified for each eye. (D,E) Immunostaining for TIMP2 in the inner retina for L/D-reared efemp1+/+, L/D-reared efemp12C-Cas9, D/D-reared efemp1+/+ and D/D-reared efemp12C-Cas9 fish after 2 days (D; n=16, 16, 16 and 15 retinae, respectively) and 4 weeks (E; n=13, 14, 15 and 14 retinae, respectively) of treatment. Average normalized expression is shown in Di and Ei and summed normalized expression for (Dii and Eii) ACL, (Diii and Eiii) IPL and (Div and Eiv) GCL. (F,G) Immunostaining for MMP2 for L/D-reared efemp1+/+, L/D-reared efemp12C-Cas9, D/D-reared efemp1+/+ and D/D-reared efemp12C-Cas9 fish after 2 days (F; n=16, 16, 12 and 15 retinae, respectively) and 4 weeks (G; n=13, 13, 12 and 15 retinae, respectively) of treatment. Average normalized expression is shown in Fi and Gi and summed normalized expression for (Fii and Gii) ACL, (Fiii and Giii) IPL and (Fiv and Giv) GCL. Scale bar in G represents 20 μm and all images share the same scale. Group data are shown as mean±s.e.m. Two-way ANOVA and Fisher's LSD post-hoc tests were performed. Significant main effects of genotypes (G), rearing conditions (E) and their interactions (G×E) are indicated in the graphs. *P<0.05; **P<0.01; ***P<0.001; ****P<0.0001.

Acknowledgments
This image is the copyrighted work of the attributed author or publisher, and ZFIN has permission only to display this image to its users. Additional permissions should be obtained from the applicable author or publisher of the image. Full text @ Biol. Open