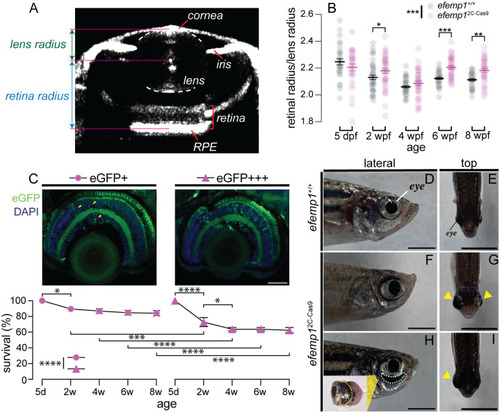
Ocular development of efemp12C-Cas9 fish under normal rearing. (A) Representative optical coherence tomography (OCT) image showing eye components, including the cornea, iris, lens, retina and retinal pigment epithelium (RPE). Relative ocular refraction was calculated as the ratio of retinal radius to lens radius. (B) Ocular refraction of efemp1+/+ and efemp12C-Cas9 fish at 5 days post-fertilization (dpf; n=30 and 29 eyes, respectively), and 2 (n=40 per genotype), 4 (n=40 and 38 eyes, respectively), 6 (n=39 and 40 eyes, respectively), and 8 weeks post-fertilization (wpf; n=40 and 34 eyes, respectively). Group data are shown as mean±s.e.m. (C) efemp12C-Cas9 fish were categorized into two groups based on their retinal eGFP levels (eGFP+ versus eGFP+++). Sporadic eGFP positive cells (highlighted by yellow arrows) are evident in the eGFP+ retinal image, whereas the eGFP+++ retinal image had more EGFP cells. Scale bar: 40 μm. Survival rates for eGFP+ and eGFP+++ groups from 5 days (d; set as 100%) to 8 weeks (w) of age are presented as mean±s.e.m. Three tanks per group were analyzed. *P<0.05; **P<0.01; ****P<0.0001. Two-way ANOVA and Fisher's LSD post-hoc tests were performed. In C, for comparisons within each eGFP level, only significant survival differences between a time point and its adjacent time are shown. (D–I) Representative images of eye morphology for efemp1+/+ (D,E) and efemp12C-Cas9 fish (F–I) reared under normal lighting at 1 years old. Yellow arrowheads indicate enlarged eyes. Dashed region below the eye in H highlights a scleral crack shown in the zoom-in image insert, in which the yellow dashed line indicates the estimated normal position of the posterior eye of zebrafish. Scale bars: 3 mm.
|
