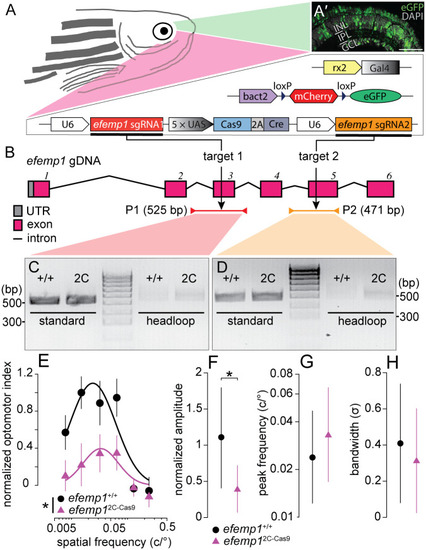
Genotypic details of retina-specific efemp1-modified mutants (efemp12C-Cas9) and phenotypic verification via optomotor responses at 5 days post-fertilization (dpf). (A) The efemp12C-Cas9 fish were generated using 2C-Cas9 somatic gene editing. Mutant fish have three separate transgenes: Tg(rx2:Gal4)×Tg(bact2-loxP-mCherry-loxP-eGFP)×Tg(UAS:Cas9T2ACre;U6:efemp1sgRNA1;U6:efemp1sgRNA2). Co-expression of these transgenic elements result in expression of green fluorescence (eGFP) in zebrafish retina, indicative of successful Cas9 protein expression. (A′) Representative retinal image from a 6 dpf fish. Nuclei stained with DAPI are shown in grey. INL, inner nuclear layer; IPL, inner plexiform layer; GCL, ganglion cell layer. Scale bar: 40 μm. (B) The universally expressed efemp1 sgRNA1 and sgRNA2 from the transgene binds with Cas9 nucleases and cuts exons 3 and 5 of the efemp1 genome DNA (gDNA), respectively. Standard PCR primers used for genotyping the target sites 1 and 2 amplified 525- (Product 1, P1; spinning from the introns before to after the exon 3) and 471-base pairs (bp; P2; spinning from the intron before to the end of exon 5) of DNA sequences, respectively. Products of headloop PCR are 23-bp longer for P1 and 20-bp longer for P2 due to the headloop tags in reverse primers. UTR, untranslated region. (C,D) Gel electrophoresis of the products from standard and headloop PCR for genotyping targeted sites 1 (C) and 2 (D). In both images, the middle lanes show a 100-bp reference ladder; positions of 300 and 500 bp of size are indicated for both gel images. (E–H) Results of optomotor responses. Spatial-frequency tuning functions (E) for 5 dpf efemp1+/+ (n=14) and efemp12C-Cas9 fish (n=13) are three-parameter log-Gaussian functions fit to the data by minimizing the least-square error. The fitted parameters, including (F) normalized amplitude, (G) peak frequency and (H) bandwidth, were compared between groups. Group data are shown as mean±s.e.m. in E and mean with 95% confidence intervals in F–H. *P<0.05 (F-test).
|
