FIGURE SUMMARY
Title

Loss of Stim2 in zebrafish induces glaucoma-like phenotype

Authors
Baranykova, S., Gupta, R.K., Kajdasz, A., Wasilewska, I., Macias, M., Szybinska, A., W?gierski, T., Nahia, K.A., Mondal, S.S., Winata, C.L., Ku?nicki, J., Majewski, L.
Source
Full text @ Sci. Rep.

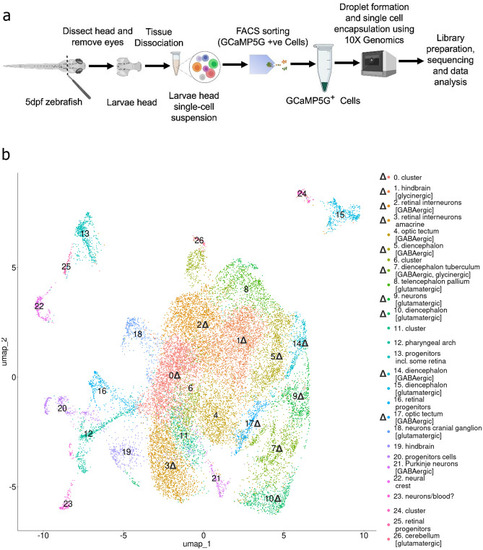
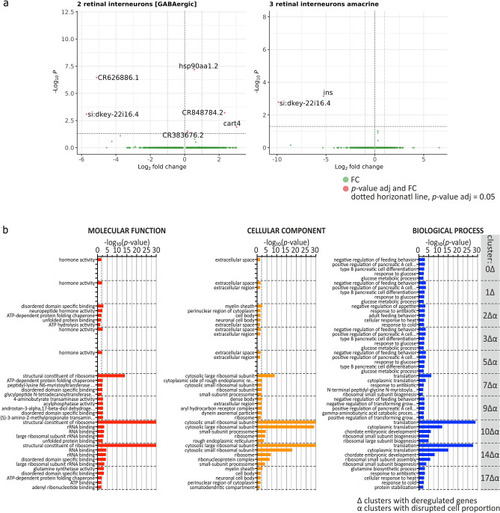
Single-cell RNA-seq analysis of cells of neuronal origin. (a) Schematic of cell preparation and processing of the 5 dpf zebrafish brain. The procedure begins with the dissecting of the zebrafish larvae head and removal of the eyes. The larvae heads are then dissociated to create a single-cell suspension. Fluorescence-activated cell sorting (FACS) is used to isolate GCaMP5G-positive cells, which are indicative of neuronal origin. These cells are encapsulated in droplets using 10× Genomics technology for single-cell RNA sequencing (scRNA-seq). The encapsulated cells undergo library preparation, sequencing, and subsequent data analysis to assess gene expression. (b) UMAP representation demonstrates the distribution of control and stim2 KO zebrafish brain cells of neuronal origin. A total of 27 clusters were identified. Upright triangle symbols (Δ) show clusters with DEGs between stim2 KO and control cells (adjusted p < 0.05). Thirty larvae were used for each sample, and two samples of each line stim2 KO and controls were sequenced.

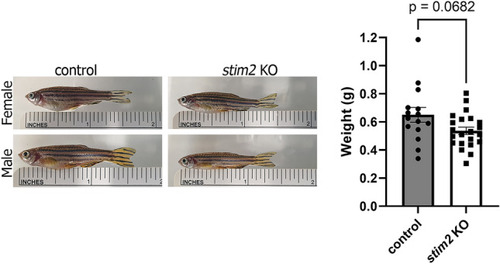
Differentially expressed genes in different clusters in
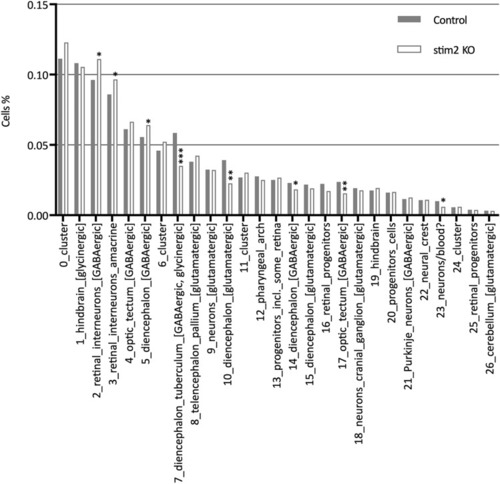
 stim2 KO zebrafish and the GO analysis. (a) Volcano plots of differentially expressed genes in clusters 2Δ and 3Δ. Genes significantly deregulated in each cluster are labeled. Horizontal dotted line indicates p-value adjusted = 0.05; green dot represent genes with not-significantly changed expression; red dots represent genes with significantly changed expression (p-value adjusted < 0.05 and log2 fold change (FC) different from 0). (b) Gene Ontology enrichment analysis of DEGs showing molecular function (red bars), cellular component (orange bars), and biological process (blue bars) aspects of 10 clusters with DEGs. All GO terms are presented for p < 0.05 (Fisher’s test). Up to five GO terms are presented for each cluster. Δ, clusters with dysregulated genes identified; α, clusters with dysregulated proportion of cells.

Changes in weight between stim2 KO zebrafish and control adult fish. stim2 KO zebrafish weighed considerably less than controls. n = 22 stim2 KO (7 females, 15 males), 15 control (7 females, 8 males). The scatter dot plots represent mean values ± standard error of the mean. Statistical analyses were performed using an unpaired t-test with Welch’s correction. Data passed the Shapiro–Wilk normality test and Rout method for eliminating outliers.

Cell proportions in stim2 KO zebrafish (white bars) and control (gray bars) clusters. Asterisks mark clusters with significant changes in cell proportions in stim2 KO relative to control. Significance of change in cells proportions in clusters were calculated using t-test with Benjamini and Hochberg FDRs (False Discover Rates, *FDR < 0.05, **FDR < 0.01, ***FDR < 0.001). The proportion of cells was calculated using the propeller function (speckle v. 1.2 package) with arcsin square root transformation (see “Materials and methods”).

Immunofluorescence visualization of cells in the retina of 5 dpf zebrafish larvae. (a) Photoreceptors (orange arrows) were stained with anti-opsin antibodies (green), and amacrine cells (yellow arrows) were stained with GABA antibodies (red). Nuclei were stained with Hoechst 33342 (blue). (b) (left) Representative retina image stained as above. (middle) Masks covering the inner nuclear (INL) and photoreceptor layers (PL) (right). Labeled nuclei contained in those layers. (c) Cell densities among the investigated retina layers, estimated as the number of cells that were positive for opsin or GABA above the fluorescence and size thresholds and normalized to surface volume of the mask. The photoreceptor layer and INL were 1.29 × and 1.78 × larger in control retinas of 5 dpf larvae. n = 7 stim2 KO, 5 control. The scatter dot plots represent mean values ± standard error of the mean. In the case of the photoreceptor cell density analysis, the Mann–Whitney test was conducted because the data did not pass the Shapiro–Wilk normality test. Statistical analyses of INL cell density were performed using an unpaired t-test with Welch’s correction because the data passed the Shapiro–Wilk normality test. The Rout method for eliminating outliers did not reveal any outliers among the tested conditions.

Transmission electron microscopy analysis revealed a decrease in IPL width as a consequence of ganglion cell perturbations. Left images show control samples and right images—stim2 KO samples. (a) Narrowing of the IPL in stim2 KO retina with visible malformations of ganglion cell dendrites. The yellow dotted lines indicate borders of the IPL. (b) The number of dendrites decreased in the IPL in stim2 KO zebrafish, and their shape was altered. Arrows point to dendrites. (c) Narrowing of the GCL in stim2 KO zebrafish, with a substantial decrease in the number of ganglion cells. Yellow dotted lines indicate borders of the GCL. The scatter dot plots represent mean values ± standard error of the mean. Images from at least four larvae were analyzed in (ac). Statistical analyses were performed using an unpaired t-test with Welch’s correction. Data passed the Shapiro–Wilk normality test. (d) The number of microglia within GCL increased (arrows indicate the microglia cells). The Mann–Whitney test was conducted because the data did not pass the Shapiro–Wilk normality test; at least 5 larvae per variant were analyzed.

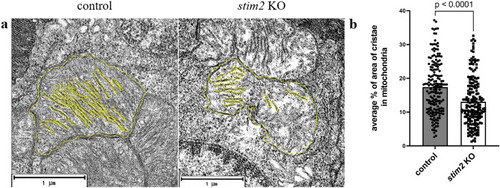
Cristae area in mitochondria of zebrafish photoreceptors. (a) Transmission electron microscopy image of mitochondria from 5 dpf zebrafish larvae with hand-labeled cristae. (b) Ratio of cristae area to area of mitochondria measured using ImageJ software in three pairs of control and stim2 KO zebrafish. Each pair contained at least 40 TEM images of 190 stim2 KO mitochondria and 160 controls. The data were analyzed using unpaired t-test.

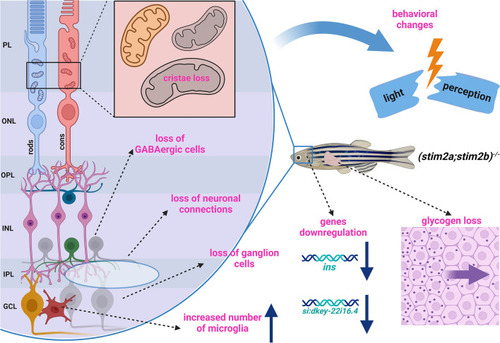
Pleiotrophic effect of stim2 knockout resembling glaucoma like phenotype in zebrafish. Loss of Stim2 leads to impairment of GABAergic connections, resulting in loss of ganglion cells, causing changes in light perception. Increase in microglia number and their activation36, glycogen deficiency36 as well as mitochondria alterations may be a consequence of the insulin downregulation seen in stim2 KO. GCL, Ganglion cell layer; IPL, inner plexiform layer; INL, inner nuclear layer; OPL, outer plexiform layer; PL, photoreceptor layer.

Acknowledgments
This image is the copyrighted work of the attributed author or publisher, and ZFIN has permission only to display this image to its users. Additional permissions should be obtained from the applicable author or publisher of the image. Full text @ Sci. Rep.