IMAGE

Fig. 6

ID
ZDB-IMAGE-241023-76
Source
Figures for Baranykova et al., 2024
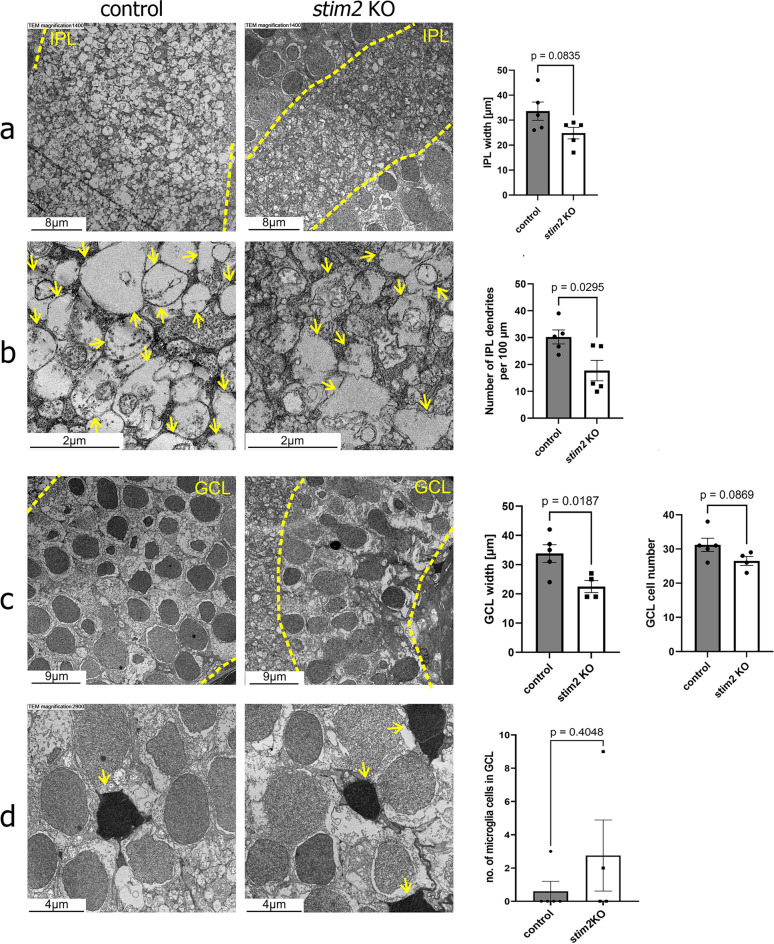
Image
Figure Caption

Fig. 6

Transmission electron microscopy analysis revealed a decrease in IPL width as a consequence of ganglion cell perturbations. Left images show control samples and right images—stim2 KO samples. (a) Narrowing of the IPL in stim2 KO retina with visible malformations of ganglion cell dendrites. The yellow dotted lines indicate borders of the IPL. (b) The number of dendrites decreased in the IPL in stim2 KO zebrafish, and their shape was altered. Arrows point to dendrites. (c) Narrowing of the GCL in stim2 KO zebrafish, with a substantial decrease in the number of ganglion cells. Yellow dotted lines indicate borders of the GCL. The scatter dot plots represent mean values ± standard error of the mean. Images from at least four larvae were analyzed in (ac). Statistical analyses were performed using an unpaired t-test with Welch’s correction. Data passed the Shapiro–Wilk normality test. (d) The number of microglia within GCL increased (arrows indicate the microglia cells). The Mann–Whitney test was conducted because the data did not pass the Shapiro–Wilk normality test; at least 5 larvae per variant were analyzed.

Figure Data
Acknowledgments
This image is the copyrighted work of the attributed author or publisher, and ZFIN has permission only to display this image to its users. Additional permissions should be obtained from the applicable author or publisher of the image. Full text @ Sci. Rep.