IMAGE

Fig. 1

ID
ZDB-IMAGE-241023-70
Source
Figures for Baranykova et al., 2024
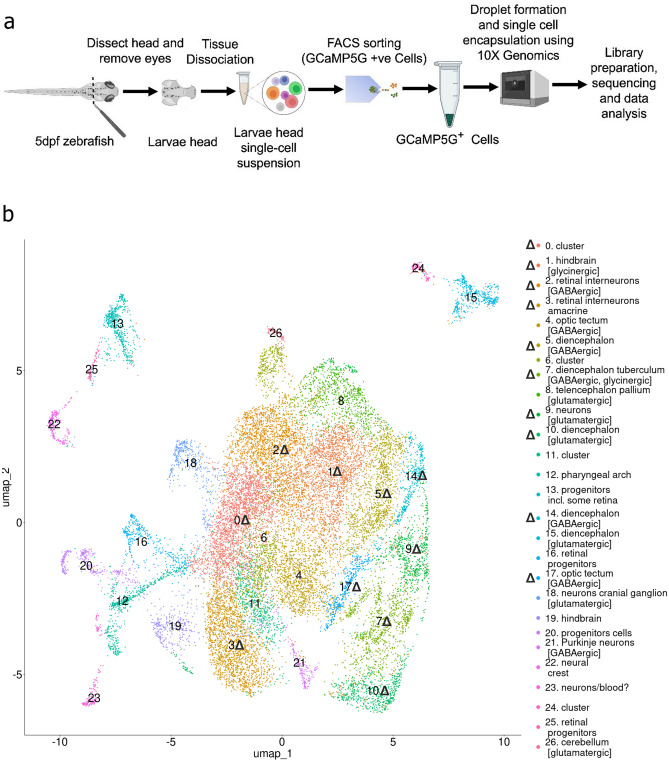
Image
Figure Caption

Fig. 1

Single-cell RNA-seq analysis of cells of neuronal origin. (a) Schematic of cell preparation and processing of the 5 dpf zebrafish brain. The procedure begins with the dissecting of the zebrafish larvae head and removal of the eyes. The larvae heads are then dissociated to create a single-cell suspension. Fluorescence-activated cell sorting (FACS) is used to isolate GCaMP5G-positive cells, which are indicative of neuronal origin. These cells are encapsulated in droplets using 10× Genomics technology for single-cell RNA sequencing (scRNA-seq). The encapsulated cells undergo library preparation, sequencing, and subsequent data analysis to assess gene expression. (b) UMAP representation demonstrates the distribution of control and stim2 KO zebrafish brain cells of neuronal origin. A total of 27 clusters were identified. Upright triangle symbols (Δ) show clusters with DEGs between stim2 KO and control cells (adjusted p < 0.05). Thirty larvae were used for each sample, and two samples of each line stim2 KO and controls were sequenced.

Acknowledgments
This image is the copyrighted work of the attributed author or publisher, and ZFIN has permission only to display this image to its users. Additional permissions should be obtained from the applicable author or publisher of the image. Full text @ Sci. Rep.