
Fig. 5
- ID
- ZDB-IMAGE-241023-74
- Antibodies
- Publication
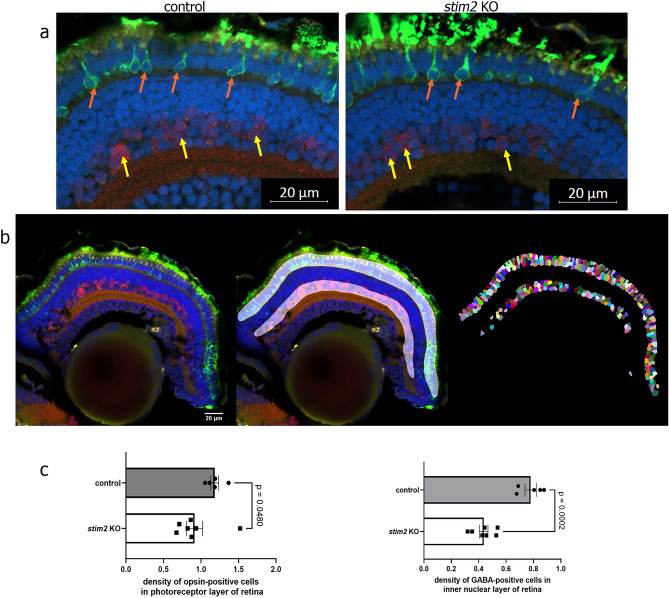
- Baranykova et al., 2024 - Loss of Stim2 in zebrafish induces glaucoma-like phenotype
- All Figures
- Figures for Baranykova et al., 2024
|
Fig. 5
Immunofluorescence visualization of cells in the retina of 5 dpf zebrafish larvae. (