
- Title
-
A conserved fertilization complex bridges sperm and egg in vertebrates
- Authors
- Deneke, V.E., Blaha, A., Lu, Y., Suwita, J.P., Draper, J.M., Phan, C.S., Panser, K., Schleiffer, A., Jacob, L., Humer, T., Stejskal, K., Krssakova, G., Roitinger, E., Handler, D., Kamoshita, M., Vance, T.D.R., Wang, X., Surm, J.M., Moran, Y., Lee, J.E., Ikawa, M., Pauli, A.
- Source
- Full text @ Cell

AlphaFold-Multimer predicts the formation of a trimeric complex (A) Outline of the AlphaFold-Multimer (v2)37,38 screen predicting putative protein-protein interactions of Izumo1, Spaca6, Dcst1, and Dcst2, with ∼1,400 testis-expressed secreted and membrane proteins. (B) Violin plot of AlphaFold-Multimer ipTM scores split by bait (interface-predicted template modeling [ipTM] score). The pairwise predictions between Izumo1, Spaca6, and Tmem81 are highlighted. (C) Phylogenetic protein tree of Tmem81 (red), Izumo1 (yellow), and Spaca6 (blue). See Figure S1A for extended tree. (D) Tertiary structure AlphaFold236 predictions of zebrafish Tmem81, Izumo1, and Spaca6 ectodomains with flexible linkers and transmembrane helices as schemes. (E–G) Predicted structural models of the trimeric sperm complex in zebrafish (E) and mice (G). Ectodomains are shown in two orientations. Predicted aligned error (PAE) plots (F) of the top-scoring models of the zebrafish (top) and mouse (bottom) trimeric complexes containing the full-length mature proteins. PAE is a confidence measure for the relative position of any two residues within the predicted structure. Index: amino acid residues. See also Figures S1 and S2. |

Tmem81 is essential for male fertility in zebrafish and mice (A) In vivo fertilization rates in zebrafish. Males or females of the indicated genotypes were crossed with wild-type zebrafish. tg[tmem81]: tmem81−/− fish expressing transgenic Tmem81-3xFLAG-sfGFP; tg[izumo1]: izumo1−/− fish expressing transgenic Izumo1-3xFLAG-sfGFP. (B) Sperm-egg binding assay in zebrafish. Sperm labeled with MitoTracker (yellow) was incubated with activated, dechorionated wild-type eggs. Representative images of wild-type and tmem81 KO sperm binding to the surface of the egg 2 min after sperm addition. The boxed region is shown at higher magnification below. Quantification of stably bound sperm per 100 μm over a period of 2 min. (C) In vivo fertilization rates of male mice after 8-week pairings with wild-type females. (D) In vitro fertilization rates using wild-type or Tmem81 KO murine sperm and ZP-free wild-type eggs. (E) Sperm-oolemma binding assay in mice. Representative images of wild-type and Tmem81 KO sperm stained for IZUMO1 (green) and DNA (Hoechst, blue). Filled arrowheads: acrosome-reacted sperm; open arrowheads: acrosome-intact sperm. Quantification of total number of sperm and number of the acrosome-reacted sperm bound to the oolemma. (F) Sperm-oolemma fusion assay in mice by Hoechst transfer into sperm from pre-loaded eggs. Representative images of the sperm-oolemma fusion assay in mice. Arrow heads: fused sperm; asterisks: egg meiosis II chromosomes. Bar graphs represent mean ± SD. p values calculated by Kruskal-Wallis test with Dunn’s multiple comparisons test (A and C), Wilcoxon test (B), or Mann-Whitney test (E and F). See also Figure S3. |
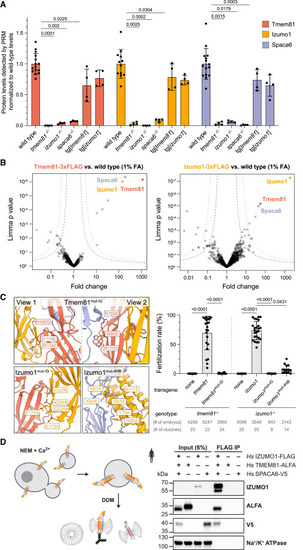
Human and zebrafish IZUMO1, SPACA6, and TMEM81 interact (A) Relative protein levels in wild-type and mutant zebrafish sperm by PRM-MS42 normalized to 6 constant proteins. (B) Volcano plots of differentially enriched proteins in FLAG coIPs from gently fixed sperm expressing Tmem81-3xFLAG-sfGFP (left) or Izumo1-3xFLAG-sfGFP (right) versus wild-type sperm. Trimer members are highlighted. False discovery rate (FDR) thresholds43 indicated as dotted (1% FDR) and dashed lines (5% FDR). (C) Complex formation between Izumo1, Spaca6, and Tmem81 is required for male fertility in zebrafish. Left: zoomed-in views of the predicted interfaces between zebrafish Izumo1 (yellow), Spaca6 (blue), and Tmem81 (red) with mutated amino acids shown as sticks as modeled by AlphaFold-Multimer. Right: fertilization rates in zebrafish of transgenic males in the respective mutant background with wild-type females. Fertilization rates for tmem81−/−, tg[tmem81], izumo1−/−, and tg[izumo1] replotted from Figure 2A. (D) Human orthologs interact in vitro. Freestyle 293-F cells were transfected to co-express full-length human sperm trimer proteins and induced to shed giant plasma membrane vesicles (GPMVs)44 with N-ethylmaleimide (NEM) and Ca2+. n-Dodecyl-β-D-maltoside (DDM)-solubilized GPMVs were used for coIP. Western blot of FLAG coIP after co-expression of Hs IZUMO1-3xFLAG, Hs SPACA6-3xV5, and Hs TMEM81-ALFA or the individual proteins. The plasma membrane protein Na+/K+ ATPase controls for non-specific capture of membrane fragments. Bar graphs represent mean ± SD. Significant p values calculated by Kruskal-Wallis test with Dunn’s multiple comparisons test. All other comparisons are non-significant. See also Figure S4. |

The conserved sperm trimer binds to divergent egg proteins in vertebrates (A) Predicted structural model of a tetrameric complex of the egg protein Bouncer (light blue) bound to the zebrafish trimeric complex on sperm. Zoom-in of Bouncer binding the cleft between Izumo1 and Spaca6 is shown in two orientations. The mutated residues are shown as sticks as modeled by AlphaFold-Multimer. Right: PAE plot of the top-scoring tetramer model containing the full-length mature proteins. Index: amino acid residues. (B) Cell-based Bouncer binding assay. HeLa cells were transfected with one plasmid encoding the sperm factors and cytoplasmic EGFP as a transfection marker. Cells were incubated with StrepII-tagged BIR2-Bouncer before fixation and immunofluorescence staining against StrepII under non-permeabilizing conditions. Representative images with StrepII (white) and EGFP (magenta). Quantification of BIR2-Bouncer/BIR2 signal intensity after Ilastik segmentation46,47 normalized to the mock transfection. (C) Bouncer binding assay after mutating predicted interface residues (A) of Spaca6 and Izumo1. Only Spaca6 and Izumo1 were encoded in the transfected plasmid. (D) Quantification of the relative surface expression of Spaca6, Izumo1, and Tmem81 constructs in HeLa cells. Immunofluorescence signal per segmented pixel was normalized to the transfection of wild-type Spaca6 and Izumo1. Representative images are shown in Figure S5G. (E) Predicted structural models of the tetrameric complexes in zebrafish and mice. In mammals, JUNO (purple) binds to IZUMO1,22,23,24 which is predicted as compatible with trimer formation. Bar graphs represent mean ± SD of at least eight images per condition across four independent experiments. Significant adj. p values by Kruskal-Wallis test with Dunn’s multiple comparisons test (B and C). All other comparisons are non-significant (p > 0.9999). See also Figure S5. |
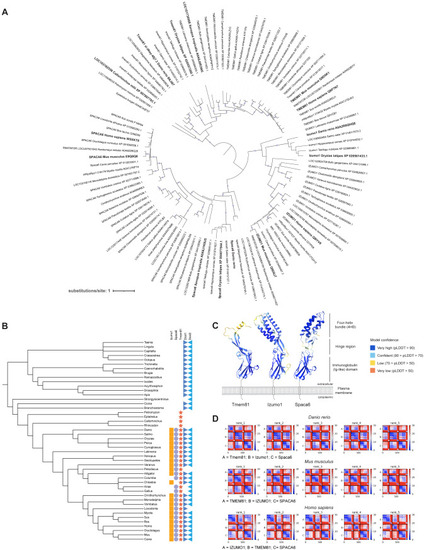
Conservation of vertebrate fertility factors and predicted interaction between Izumo1, Spaca6, and Tmem81, related to Figure 1 (A) Phylogenetic tree of Izumo1, Spaca6, and Tmem81 proteins. Bootstrap values > 94 are indicated by filled purple circles. Branch lengths represent the inferred number of amino acid substitutions per site, and branch labels are composed of gene name (if available), genus, species, and accession number. (B) Taxonomic tree of Izumo1 (orange square), Spaca6 (blue circle), Tmem81 (red star), Dcst1 (dark blue triangle), and Dcst2 (light blue triangle) across vertebrates and invertebrates. (C) Tertiary structure predictions of zebrafish Tmem81, Izumo1, and Spaca6. Each amino acid is shaded as indicated according to its predicted local distance difference test (pLDDT) score as a confidence measure. Predictions were generated by AlphaFold2.36 (D) PAE plots of the top 5 models of the predicted trimeric complexes in zebrafish (top), mouse (center), and human (bottom). Units: amino acid residues; color bar: expected position error in angstroms. |

Structural analysis of the interfaces of the predicted zebrafish and murine trimeric complexes, related to Figure 1 (A and D) Surface representation of the AlphaFold2-Multimer (v2)-predicted zebrafish (A) and murine (D) IZUMO1-TMEM81-SPACA6 complex shown in three orientations highlighting each binary interaction. Key structural properties of the model are quantified (left box). (B) Seven contact interfaces are found at the Izumo1-Spaca6-Tmem81 complex. Spaca6 and Izumo1 interact via two interfaces in the extracellular domain and one interface in the transmembrane. In Izumo1-Tmem81, two interfaces in the extracellular domain form contacts, while Tmem81-Spaca6 forms interactions between its extracellular and transmembrane domains. Electrostatic potential surface representation of the complex shows strong electrostatic complementarity at the interfaces. Residues colored in red and blue indicate electronegative and electropositive regions, respectively. Electrostatic potentials (in units of kT/e) were calculated using the program APBS.61 (C and F) Surface residue conservation of zebrafish (C) and murine (F) trimers. The degree of residue conservation is calculated in comparison with mammalian orthologs using the program Scorecons62 and shown in a gradient from high (cyan) to low (magenta) variability. Residues that are strictly conserved in mammals are listed in the figure. The footprints of the binding interfaces are shown by solid black lines. Tables provide the total interface-buried surface area and the number of interface residues, salt bridges, and hydrogen bonds per interacting protein pair. (E) Five contact interfaces are found in the murine IZUMO1-SPACA6-TMEM81 complex. SPACA6-IZUMO1 and TMEM81-SPACA6 interact via interfaces in each of their extracellular and transmembrane domains, whereas in IZUMO1-TMEM81, the extracellular domains form a single interface. Electrostatic potential surface representation of the murine IZUMO1-SPACA6-TMEM81 complex show strong electrostatic complementarity at the interfaces. See (B) for further details. All figures were generated in PyMOL (Schrodinger). |
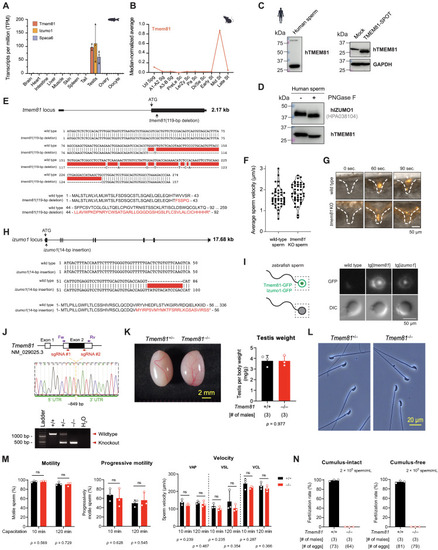
Characterization of expression and function of Tmem81 and Izumo1 in fish and Tmem81 in mice, related to Figure 2 (A) Expression of zebrafish tmem81, izumo1, and spaca6 mRNA in adult tissues (RNA sequencing [RNA-seq] data from Noda et al.15 and Herberg et l.31). (B) Median-normalized level of Tmem81 mRNA expression during mouse spermatogenesis. Tmem81 is expressed in mid-round spermatids. (C) TMEM81 is expressed in human sperm. Left: western blot analysis of human sperm probed for human TMEM81 protein. Right: the human TMEM81 antibody is specific based on western blot analysis of HEK293 cells, which were either mock transfected (negative control; lane 1) or transfected with SPOT-tagged human TMEM81 (lane 2); glyceraldehyde 3-phosphate dehydrogenase (GAPDH) is shown as loading control. (D) Human TMEM81 protein is glycosylated in human sperm. Western blot analysis of human sperm lysate treated with or without peptide-N-glycosidase (PNGase) F to remove protein glycosylation. (E) Zebrafish tmem81 mutant. Top: scheme of the zebrafish tmem81 locus (ENSDART00000062375.5), indicating the start codon (ATG) and the location of the 119-bp deletion present in the tmem81 mutant generated in this study. Exons are depicted as boxes, introns as lines. Middle: partial cDNA sequence alignment of wild-type and mutant tmem81. The tmem81 mutant has a net deletion of 119 bp highlighted in red. Bottom: partial amino acid sequence alignment for wild-type (amino acids 1–92) and mutant Tmem81. Deletion in mutant tmem81 leads to a frameshift that results in a premature stop codon. (F) Average sperm motility for wild-type and tmem81 mutant sperm. Violin plot indicates quartiles. (G) Time-lapse images of sperm approaching the micropyle of wild-type eggs. Representative time series of MitoTracker-labeled wild-type (top) and tmem81 KO (bottom) sperm (orange) approaching the micropyle (white dashed lines). (H) Zebrafish izumo1 mutant. Top: scheme of the zebrafish izumo1 locus (ENSDART00000184278.1), indicating the start codon (ATG) and the location of the 14-bp insertion present in the izumo1 mutant generated in this study. Exons are depicted as boxes, introns as lines. Middle: partial cDNA sequence alignment of wild-type and mutant izumo1. The izumo1 mutant has a 14-bp insertion highlighted in red. Bottom: partial amino acid sequence alignment for wild-type (amino acids 1–56) and mutant Izumo1. Insertion in mutant izumo1 leads to a frameshift that results in a premature stop codon. (I) Localization of transgenically expressed Tmem81-3xFLAG-sfGFP and Izumo1-3xFLAG-sfGFP in live mature unactivated zebrafish sperm. A scheme of zebrafish sperm and the protein localization in sperm is shown on the left; the box indicates the zoomed view in the images. (J) KO strategy of mouse Tmem81 using two single-guide RNAs (sgRNAs) flanking its coding exon. A 849-bp deletion was introduced at the locus of Tmem81. Forward (Fw) and reverse (Rv) primers targeting the 5′ and 3′ untranslated regions (UTRs), respectively, were used for genomic PCR to detect the Tmem81 KO allele. (K) Gross appearance of Tmem81+/− and Tmem81−/− testes and testis weights in wild-type and Tmem81−/− males. (L) Sperm morphology in Tmem81+/− and Tmem81−/− males. (M) Sperm motility, progressive motility, and swimming velocity in wild-type and Tmem81−/− males. (N) In vitro fertilization between sperm and cumulus-intact (left) or cumulus-free eggs (right). Bar graphs represent mean ± SD. p values calculated by Student's t test (K and M). Abbreviations are as follows: Ud Spg, undifferentiated spermatogonia; A1-A2 Sg, A1-A2 differentiating spermatogonia; A3-B Sg, A3-A4-In-B differentiating spermatogonia; PreLe Sc, preleptotene spermatocytes; Le/Zy Sc, leptotene/zygotene spermatocytes; Pa Sc, pachytene spermatocytes; Di/Se Sc, diplotene/secondary spermatocytes; Early St, early round spermatids; Mid St, mid round spermatids; Late St, late round spermatids; VAP, velocity average path; VSL, velocity straight line; VCL, velocity curvilinear. |
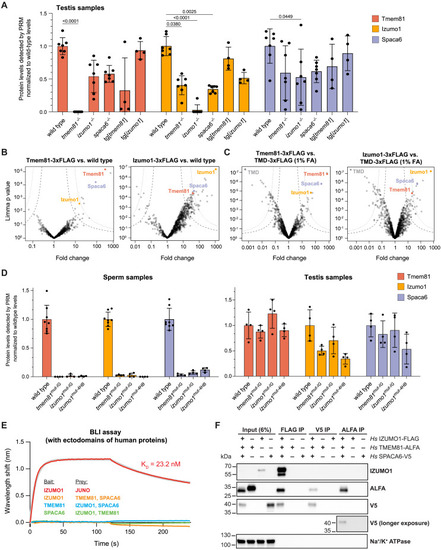
Experimental evidence for the interaction of Izumo1, Spaca6, and Tmem81 in zebrafish sperm and upon expression of the full-length human proteins in vitro, related to Figure 3 (A) Parallel reaction monitoring (PRM)42 mass spectrometry quantification of detected protein levels of Tmem81 (red), Izumo1 (yellow), and Spaca6 (blue) in wild-type and mutant zebrafish testis. Data were normalized by the loaded protein amount determined by 8 constant proteins and are shown relative to the mean wild-type level of each trimer member. In the case of Spaca6, 4 out of 5 peptides used for scheduled PRM (sPRM)-based quantification of Spaca6 protein levels lie upstream of the frameshift introduced in our spaca6−/− mutant, which is in line with the observed detection of these 4 peptides in spaca6−/− testis samples (but not sperm samples, where the C-terminally truncated Spaca6 is degraded). Of note, the 5th peptide, which lies downstream of the frameshift introduced in our spaca6−/− mutant, was neither detected in testis nor sperm samples, confirming the spaca6−/− genotype. Significant p values calculated by Kruskal-Wallis test with Dunn's mutiple comparisons test. All other comparisons are non-significant. (B and C) Volcano plots of differentially enriched proteins in FLAG coIPs from Tmem81-3xFLAG-sfGFP- or Izumo1-3xFLAG-sfGFP-expressing sperm versus wild-type sperm (B) or transmembrane domain (TMD)-3xFLAG-sfGFP-expressing sperm (C). Sperm samples in (B) were not crosslinked; sperm samples in (C) were lysed after crosslinking with 1% formaldehyde (FA) similar as shown in Figures 3B and 3C. (D) PRM mass spectrometry quantification of detected protein levels of Tmem81 (red), Izumo1 (yellow), and Spaca6 (blue) in wild-type and interface mutant zebrafish sperm (left) or testis (right). Those measured peptides that contained mutated residues were excluded from the analysis. (E) Biolayer interferometry (BLI) measurements to detect interactions between purified recombinant ectodomains of human trimer members. Four reciprocal BLI sensorgrams were measured: (1) positive control: biotinylated IZUMO1 as bait with association of 0.5 μM JUNO analyte (red curve), fitted curve (gray curve) was superimposed, (2) biotinylated IZUMO1 as bait with association of 5 μM TMEM81 and SPACA6 (orange curve), (3) biotinylated TMEM81 as bait with association of 5 μM IZUMO1 and SPACA6 (blue curve), and (4) biotinylated SPACA6 as bait with association of 5 μM IZUMO1 and TMEM81 (green curve). A single representative sensorgram was selected from triplicate measurements and shown here. (F) Western blot of human full-length trimer coIPs, including the reciprocal ALFA and V5 IPs from solubilized GPMVs from cells co-expressing Hs IZUMO1-3xFLAG, Hs SPACA6-3xV5, and Hs TMEM81-ALFA or expressing the individual proteins. Note that this western blot shows the complete results of the experiment described in Figure 3D, where only the input and FLAG IP are shown. The plasma membrane protein Na+/K+ ATPase is controlling for non-specific capture of membrane fragments. One western blot from three independent replicates is shown. Bar graphs represent mean ± SD. |
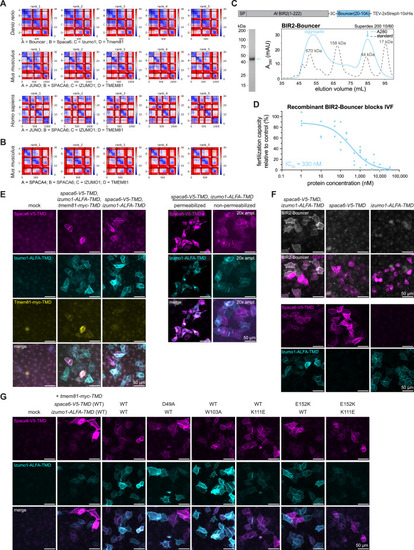
Recombinant Bouncer binding confirms the interaction between zebrafish Bouncer and the zebrafish trimeric complex, related to Figure 4 (A and B) PAE plots of the top 5 models of the sperm trimeric complex (Spaca6, Izumo1, and Tmem81) predicted to interact with the egg proteins Bouncer (in zebrafish) and JUNO (in mice and humans) (A), but not predicted to interact with the sperm protein SPACA4 in mice (B). Units: amino acid residues; color bar: expected position error in angstroms. (C) Construct architecture of recombinant BIR2-Bouncer and chromatogram of BIR2-Bouncer size exclusion chromatography (SEC, blue trace). Dotted line traces a run of the same column resolving the gel filtration standard (BioRad). Arrow indicates the fraction analyzed by SDS-PAGE on the right (InstantBlue staining). SEC and PAGE reveal monomeric protein (calculated mass: 36.9 kDa). Experiments were performed using concentrated protein of the monomeric peak. (D) Dose-response curve of the fertilization capacity of wild-type sperm in in vitro fertilization (IVF) after incubation with recombinant Bouncer. To account for clutch-to-clutch variation, eggs were stripped from a single zebrafish female into two dishes. Sperm, which was either incubated with BIR2-Bouncer or control protein (BIR2 or BSA), was used to perform IVF. To determine the fertilization capacity, the fertilization rate of the Bouncer-incubated sperm was divided by the rate of the control. Each data point represents a split clutch from one female. Per tested concentration, at least three clutches were tested across six independent experiments. (E) To visualize surface expression of the sperm trimer in HeLa cells, the proteins were extracellularly tagged in the linker between the Ig-like domain and the transmembrane domain (TMD) with short epitope tags: Spaca6-2xV5-TMD, Izumo1-ALFA-TMD, and Tmem81-2xMyc-TMD. Left: counter-staining against the V5-, ALFA-, and myc-tags under non-permeabilizing conditions showed detectable levels of Spaca6 (magenta), Izumo1 (cyan), and Tmem81 (yellow). Even after accounting for bleed-through of the Izumo1 channel into the Tmem81 channel, a fraction of transfected cells carry detectable levels of all three proteins on the surface. Right: staining for Spaca6 and Izumo1 under permeabilizing conditions revealed that the vast majority of Spaca6 and Izumo1 proteins were retained within the cell. Images of permeabilized and non-permeabilized cells were acquired using identical imaging conditions; the pixel values of the non-permeabilized condition were multiplied by 20 to visualize the weaker signal. (F) Assessment of Bouncer binding to cells expressing either both Izumo1 and Spaca6 or only the single proteins. Top two rows: representative images of the Bouncer binding assay revealed that Bouncer binding requires both sperm factors. Bottom two rows: to visualize surface expression, extracellularly V5- or ALFA-tagged Spaca6 and Izumo1 were detected via counter-staining against V5 and ALFA under non-permeabilizing conditions, revealing detectable levels of Spaca6 (magenta) and Izumo1 (cyan) even when expressed individually. (G) Assessment of the surface expression of Spaca6 and Izumo1 between the tested constructs. Representative images of the surface staining of Spaca6 (magenta) and Izumo1 (cyan). Quantifications are shown in Figure 4D. |
Reprinted from Cell, 187(25), Deneke, V.E., Blaha, A., Lu, Y., Suwita, J.P., Draper, J.M., Phan, C.S., Panser, K., Schleiffer, A., Jacob, L., Humer, T., Stejskal, K., Krssakova, G., Roitinger, E., Handler, D., Kamoshita, M., Vance, T.D.R., Wang, X., Surm, J.M., Moran, Y., Lee, J.E., Ikawa, M., Pauli, A., A conserved fertilization complex bridges sperm and egg in vertebrates, 7066-7078.e22, Copyright (2024) with permission from Elsevier. Full text @ Cell