FIGURE SUMMARY
Title

A sphingolipid rheostat controls apoptosis versus apical cell extrusion as alternative tumour-suppressive mechanisms

Authors
Armistead, J., Höpfl, S., Goldhausen, P., Müller-Hartmann, A., Fahle, E., Hatzold, J., Franzen, R., Brodesser, S., Radde, N.E., Hammerschmidt, M.
Source
Full text @ Cell Death Dis.

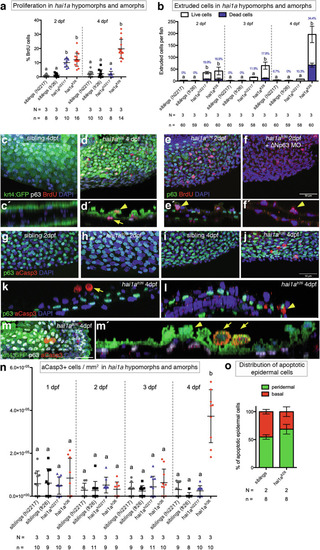
Comparison of proliferation, apical cell extrusion, and apoptosis phenotypes in the hai1ahi2217 hypomorphic and the hai1afr26 amorphic alleles.

a Comparison of proliferation rates in the hai1ahi2217 hypomorphic and the hai1afr26 amorphic alleles at 2 and 4 dpf, relative to the total number of cells. b Quantification of extruded epidermal cells in the hai1ahi2217 hypomorphic and the hai1afr26 amorphic alleles at 2, 3 and 4 dpf, collected from the embryo growth medium. White bars show the numbers of live cells, blue bars show the number of dead cells, with the proportion of dead cells in each condition indicated by blue text. c, d Representative images of proliferation assay in sibling (c) or the hai1afr26 mutant (d) epidermis at 4 dpf in the caudal fin fold with orthogonal views (c’, d’), showing BrdU-positive cells (red) within the peridermal cell layer (green, yellow arrowhead), or the basal cell layer (white, yellow arrow). e, f Proliferation assay in hai1afr26 mutant caudal fin fold epidermis without (e) and with (f) knockdown of ∆Np63 by antisense morpholino oligonucleotide (MO) to eliminate basal keratinocytes, with orthogonal views in the lower panels (e’, f’) showing BrdU-positive peridermal cells (yellow arrowheads). BrdU, red; p63, green; nuclei, blue. Scale bar = 50 μm. gj Representative images of cleaved caspase 3 (aCasp3)-positive cells on the ventral median fin fold at 2 dpf (g, h) and 4 dpf (i, j), sibling (g, i) or hai1afr26 (h, j) mutant epidermis. aCasp3, red; p63, green; nuclei, blue. Scale bar = 50 μm. k, l Orthogonal views of the epidermis of the 4 dpf mutant fish shown in (j) displaying apoptotic cells protruding above the epidermis (k), and within the basal layer (l). aCasp3, red; p63, green; nuclei, blue. m Representative image of aCasp3-positive cells in the hai1afr26 mutant at 4 dpf in the caudal fin fold with orthogonal view (m’), showing extruding live peridermal cells (green, yellow arrowhead) or extruding aCasp3-positive (red) peridermal cells (green, yellow arrows). Basal cell layer, white. Scale bar = 50 μm. n Quantification of the number of aCasp3-positive cells in the tail fin of sibling control, hai1ahi2217, and hai1afr26 mutant embryos at 1, 2, 3, and 4 dpf, normalised to fin area. o Distributions of apoptotic cells within the epidermis in siblings and hai1afr26 mutants at 4 dpf. For all graphs, means within each time point were compared using a one-way ANOVA with post-hoc Tukey’s multiple comparison test. N = number of biological replicates, n = number of fish per condition.

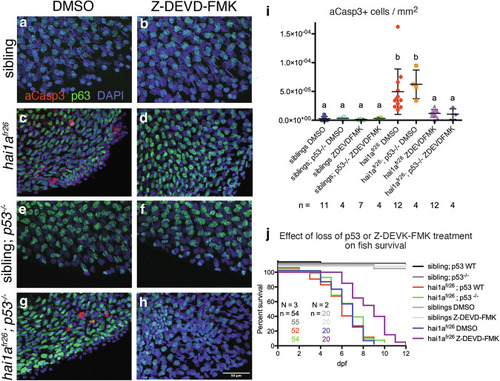
Cell death in hai1afr26 mutants is caspase-dependent and tp53-independent.

ah Apoptotic cells in the caudal fin fold of 4 dpf embryos, immunostained for aCasp3 (red), p63 (green) and DAPI (blue), with tp53 mutation or upon treatment with ZDEVD-FMK to inhibit apoptosis. Scale bar = 50 μm. i Quantification of the numbers of aCasp3-positive cells in the tail fins of embryos, normalised to fin area. Means were compared using one-way ANOVA with post-hoc Tukey’s multiple comparison test. j Survival curves showing the effects of tp53 mutation or ZDEVD-FMK treatment on embryo viability.

Sphingosine kinase activity modulates cell death in hai1afr26 mutant epidermis.

ad S1P levels are elevated in hai1afr26 mutants at 4 dpf. ac Whole mount immunostaining in the caudal fin fold, anti-S1P (white), nuclei are labelled with DAPI (blue). c shows an individual extruding cell, with the orthogonal view shown in c’. d Quantification of S1P fluorescence in the caudal fins of embryos, normalised to fin area. For full dataset including SphK inhibition, see Fig. S3g. Scale bars: (a, b) 200 µm, (c) 20 µm. e Quantification of the numbers of extruded cells collected per fish at 4 dpf upon inhibition of sphingosine kinase by MPA08 treatment. White bars show the numbers of live cells, blue bars show the numbers of dead cells, with the proportion of dead cells indicated with blue text. f Survival curves showing the effect of sphingosine kinase inhibition on embryo viability. gj Apoptotic cells in the caudal fin fold of 4 dpf hai1ahi2217 mutant embryos, with and without MPA08 treatment. Apoptotic cells are labelled with aCasp3 (red), basal keratinocytes with p63 (green), and nuclei using DAPI (blue). Scale bar = 50 μm. lo Apoptotic cells in the caudal fin fold of 4 dpf hai1afr26 mutant embryos, with and without MPA08 treatment. Apoptotic cells are labelled with aCasp3 (red), basal keratinocytes with p63 (green), and nuclei using DAPI (blue). Scale bar = 50 μm. q, r Apoptotic cells in the caudal fin fold of 4 dpf hai1afr26 mutant embryos upon S1P treatment. Apoptotic cells are labelled with aCasp3 (red), basal keratinocytes with p63 (green), and nuclei using DAPI (blue). Scale bar = 50 μm. k, p, s Quantification of numbers of aCasp3-positive cells in the tail fins of embryos, normalised to fin area. tv Apoptotic cells in the caudal fin fold of 4 dpf wild-type embryos, treated with ceramide to induce apoptosis (u), or concomitant treatment with ceramide and S1P (v). Apoptotic cells are labelled with aCasp3 (red), basal keratinocytes with p63 (green), and nuclei using DAPI (blue). Scale bar = 50 μm. w Quantification of numbers of aCasp3-positive cells in the tail fins of embryos, normalised to fin area. For (d), means of controls and mutants were compared using an unpaired, two-tailed Student’s t-test. For all other graphs, means were compared using one-way ANOVA with post-hoc Tukey’s multiple comparison test. N = number of biological replicates, n = number of fish per condition.

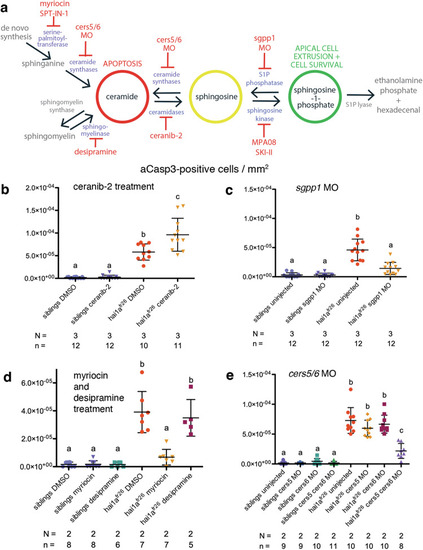
Manipulation of the sphingolipid rheostat enzymes or ceramide de novo synthesis alters cell death in the hai1afr26 mutant.

a Schematic of sphingolipid rheostat showing inhibition of ceramidases with ceranib-2, inhibition of sphingosine kinases with MPA08 or SKI-II, inhibition of S1P phosphatase with a MO targeting sgpp1, inhibition of serine palmitoyltransferase with myriocin or SPT-IN-1 and sphingomyelinases with desipramine, and MOs targeting cers5 and cers6 at the level of de novo synthesis and salvage from sphingosine. b Quantification of aCasp3-positive cells in the tail fins of 4 dpf embryos upon DMSO or ceranib-2 treatment, normalised to fin area. c Quantification of aCasp3-positive cells in the tail fins of control or sgpp1 MO-injected 4 dpf embryos, normalised to fin area. d Quantification of aCasp3-positive cells in the tail fins of 4 dpf embryos upon DMSO, myriocin, or desipramine treatment, normalised to fin area. e Quantification of aCasp3-positive cells in the tail fins of control or cers5 alone, cers6 alone, or both cers5 and cers6 MO-injected 4 dpf embryos, normalised to fin area. For all graphs, means were compared using one-way ANOVA with post-hoc Tukey’s multiple comparison test. N = number of biological replicates, n = number of fish per condition.

Early inhibition of ceramide synthesis in wild-type embryos recapitulates ACE and apoptosis phenotype.

a Loss of Matriptase inhibition leads to parallel pro-oncogenic and tumour-suppressive pathways. Sphingolipid rheostat-mediated tumour-suppressive methods include S1P-dependent apical cell extrusion, which preserves epithelial integrity, and C16 ceramide-dependent apoptotic cell death, which may lead to loss of epithelial barrier function. When levels of C16 ceramide are above a certain threshold, a negative feedback loop prevents further de novo ceramide synthesis. In hai1afr26 mutants by 2 dpf, ceramide levels drop due to sustained SphK activity catalysing S1P production, repression of de novo synthesis is lost, and resultant C16 ceramide levels trigger apoptosis. b-c Epidermal aggregates and apoptotic peridermal cells in the caudal fin fold of 4 dpf WT fish, transiently treated with inhibitor of de novo ceramide synthesis myriocin at 2 dpf, with orthogonal views (b’, c’) showing extruding live (yellow arrowhead) or apoptotic (yellow arrow) peridermal cells. Apoptotic cells are labelled with aCasp3 (red), peridermal cells with krt4:GFP (green), basal keratinocytes with p63 (white), and nuclei using DAPI (blue). Scale bar = 50 μm. d Quantification of the numbers of extruded cells collected per fish at 4 dpf upon inhibition of de novo sphingolipid synthesis by myriocin treatment at 2 dpf. White bars show the numbers of live cells, blue bars show the numbers of dead cells, with the proportion of dead cells indicated with blue text. e Quantification of aCasp3-positive cells in the tail fins of 4 dpf embryos upon myriocin treatment, normalised to fin area. f Quantification of proliferating cells in the tail fins of 4 dpf embryos upon myriocin treatment, normalised to fin area. For all graphs, means were compared via two-tailed, unpaired Student’s t-test. N = number of biological replicates, n = number of fish per condition.

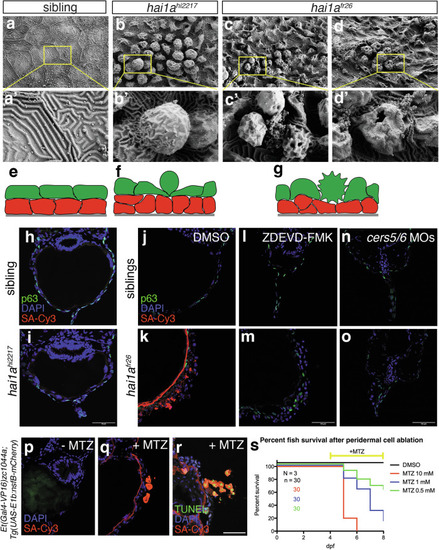
Embryo death is caused by apoptosis-induced loss of epidermal barrier.

ad Scanning electron microscopy images of the epidermal surface of sibling control (a), hai1ahi2217 hypomorphs (b), and hai1afr26 amorph mutants (c, d). eg Cartoons of the effects of hai1a mutation on epidermal morphology (basal keratinocytes in red, peridermal cells in green, underlying basement membrane in grey). h, i Biotin epidermal barrier assay on transverse cryosections in 4 dpf sibling control (h) and hai1ahi2217 (i) mutants. Basal keratinocytes are labelled with p63 (green), nuclei using DAPI (blue), and biotin using streptavidin-Cy3 (SA-Cy3, red). Scale bar = 50 μm. j, k Biotin epidermal barrier assay on transverse cryosections in 4 dpf sibling control (j) and hai1afr26 (k) mutants. Basal keratinocytes are labelled with p63 (green), nuclei using DAPI (blue), and biotin using streptavidin-Cy3 (SA-Cy3, red). Scale bar = 50 μm. lo Biotin epidermal barrier assay on transverse cryosections in 4 dpf sibling control (l, n) and hai1afr26 (m, o) mutants, treated with caspase inhibitor ZDEVD-FMK (l, m) or injected with cers5 and cers6 MOs (n, o). Basal keratinocytes are labelled with p63 (green), nuclei using DAPI (blue), and biotin using streptavidin-Cy3 (SA-Cy3, red). Scale bar = 50 μm. pr Biotin epidermal barrier assay upon peridermal cell ablation, without (p) or with (q) the prodrug metronidazole (MTZ), and using TUNEL to label dying cells (r). Nuclei are labelled using DAPI (blue), biotin using streptavidin-Cy3 (SA-Cy3, red), and dying cells using TUNEL-fluorescein (green). Scale bar = 50 μm. s Survival curves of control (DMSO) or MTZ-treated fish at different concentrations, with treatments starting from 4 dpf.

Acknowledgments
This image is the copyrighted work of the attributed author or publisher, and ZFIN has permission only to display this image to its users. Additional permissions should be obtained from the applicable author or publisher of the image. Full text @ Cell Death Dis.