|
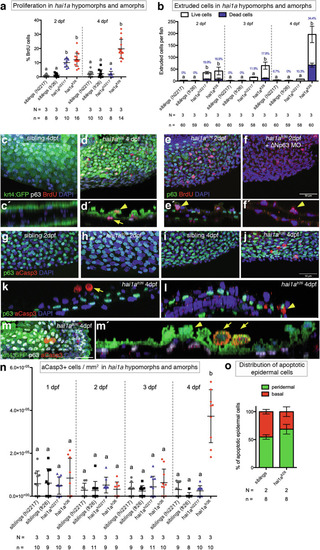
Comparison of proliferation, apical cell extrusion, and apoptosis phenotypes in the hai1ahi2217 hypomorphic and the hai1afr26 amorphic alleles. a Comparison of proliferation rates in the hai1ahi2217 hypomorphic and the hai1afr26 amorphic alleles at 2 and 4 dpf, relative to the total number of cells. b Quantification of extruded epidermal cells in the hai1ahi2217 hypomorphic and the hai1afr26 amorphic alleles at 2, 3 and 4 dpf, collected from the embryo growth medium. White bars show the numbers of live cells, blue bars show the number of dead cells, with the proportion of dead cells in each condition indicated by blue text. c, d Representative images of proliferation assay in sibling (c) or the hai1afr26 mutant (d) epidermis at 4 dpf in the caudal fin fold with orthogonal views (c’, d’), showing BrdU-positive cells (red) within the peridermal cell layer (green, yellow arrowhead), or the basal cell layer (white, yellow arrow). e, f Proliferation assay in hai1afr26 mutant caudal fin fold epidermis without (e) and with (f) knockdown of ∆Np63 by antisense morpholino oligonucleotide (MO) to eliminate basal keratinocytes, with orthogonal views in the lower panels (e’, f’) showing BrdU-positive peridermal cells (yellow arrowheads). BrdU, red; p63, green; nuclei, blue. Scale bar = 50 μm. g–j Representative images of cleaved caspase 3 (aCasp3)-positive cells on the ventral median fin fold at 2 dpf (g, h) and 4 dpf (i, j), sibling (g, i) or hai1afr26 (h, j) mutant epidermis. aCasp3, red; p63, green; nuclei, blue. Scale bar = 50 μm. k, l Orthogonal views of the epidermis of the 4 dpf mutant fish shown in (j) displaying apoptotic cells protruding above the epidermis (k), and within the basal layer (l). aCasp3, red; p63, green; nuclei, blue. m Representative image of aCasp3-positive cells in the hai1afr26 mutant at 4 dpf in the caudal fin fold with orthogonal view (m’), showing extruding live peridermal cells (green, yellow arrowhead) or extruding aCasp3-positive (red) peridermal cells (green, yellow arrows). Basal cell layer, white. Scale bar = 50 μm. n Quantification of the number of aCasp3-positive cells in the tail fin of sibling control, hai1ahi2217, and hai1afr26 mutant embryos at 1, 2, 3, and 4 dpf, normalised to fin area. o Distributions of apoptotic cells within the epidermis in siblings and hai1afr26 mutants at 4 dpf. For all graphs, means within each time point were compared using a one-way ANOVA with post-hoc Tukey’s multiple comparison test. N = number of biological replicates, n = number of fish per condition.
|