
- Title
-
First dual inhibitors of human topoisomerase IIα and Hsp90 C-terminal domain inhibit the growth of Ewing sarcoma in vitro and in vivo
- Authors
- Dernovšek, J., Urbančič, D., Zajec, Ž., Sturtzel, C., Grissenberger, S., Wenninger-Weinzierl, A., Gedgaudas, M., Zubrienė, A., Goričan, T., Golič Grdadolnik, S., Skok, Ž., Ilaš, J., Distel, M., Zidar, N., Tomašič, T.
- Source
- Full text @ Bioorg. Chem.

Structures of pyrrolamide-based dual TopoIIα and Hsp90β N-terminal domain inhibitors 1 and 2, and newly discovered dual TopoIIα and Hsp90 C-terminal domain inhibitor 3 [26]. |

Overlay of compound 3 with the structure-based pharmacophore model derived from the most representative molecular dynamics binding mode of inhibitor in the C-terminal domain binding site of the Hsp90β dimer [28] (PDB entry: 5FWK). Blue star represents a positively ionizable pharmacophore feature, green arrow a hydrogen bond donor pharmacophore feature, yellow spheres hydrophobic pharmacophore feature and grey spheres represent excluded volumes. |

Predicted binding mode of (R)-3 (in yellow sticks) in the (a) ATP-binding site of the human topoisomerase IIα (PDB entry: 4R1F, in green cartoon), and (b) allosteric binding site at the Hsp90β C-terminal domain (PDB entry: 5FWK, protomer A in grey cartoon, protomer B in cyan cartoon). Hydrogen bonds between the protein and (R)-3 are presented as black dashed lines. |
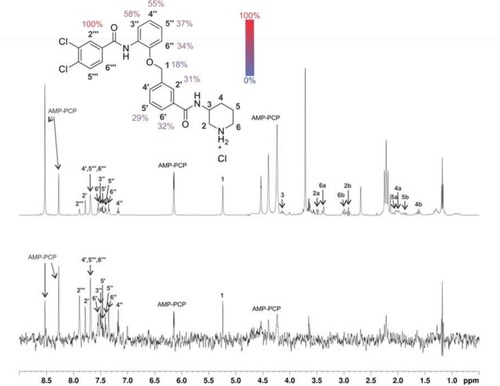
1D 1H STD NMR spectra for the compound 48 recorded at a Hsp90β:ligand ratio of 1:100 and 600 MHz. The structure of 48 shows the proton nomenclature and the color-coded relative degrees of saturation of the individual not-overlapped protons. The STD amplification factors were normalized to the intensity of the signal with the largest STD effect. The reference STD spectrum (top) with proton assignment and the difference STD spectrum (bottom) are shown. The unassigned proton signals between 3.5 and 3.8 ppm belong to protein buffer with glycerol. Signal for 3 partially overlaps with signals of AMP-PCP and signal for 2a partially overlaps with signals of protein buffer with glycerol. Intensities of 2, 3, 4, 5 and 6 are under detection limit in the difference STD spectrum. Since signals for 4′, 5‴ and 6‴ are overlapped, their STD amplification factors could not be determined. The proton signals were calibrated to the DSS signal at 0.0 ppm. The spectra are not to scale. |
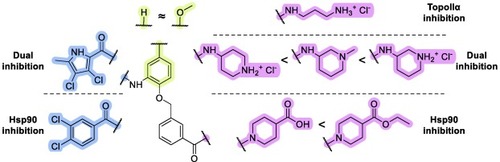
Structure-activity relationship summary for on-target activity and antiproliferative activity in cancer cells. 3,4-Dichloro-5-methylpyrrolamide (in blue) moiety is critical for dual-target inhibition, while its replacement with the 3,4-dichlorobenzamide (in blue) moiety results in selective Hsp90 CTD inhibition. Introduction of the methoxy group on the adjacent phenyl ring (in yellow) results in equipotent activity, while modification of the nitrogen-based heterocycle (in magenta) results in the most pronounced effects on target inhibition and antiproliferative activity. |
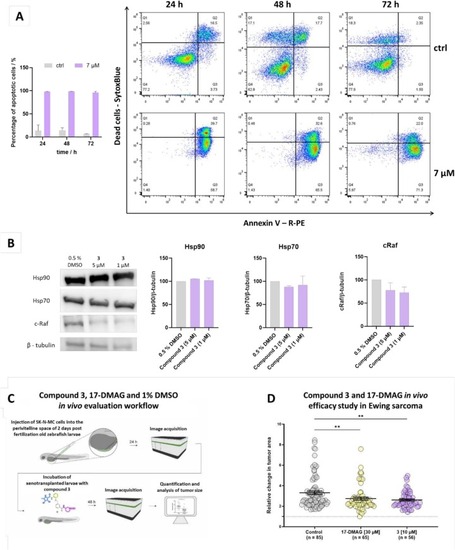
Insights into the cytostatic and cytotoxic behavior of compound 3. (A) Time dependency of apoptosis with corresponding representative experiments measuring the changes in proportion of Annexin V and/or SytoxBlue positive SK-N-MC cells (right). The bar graph represents means and SD of at least two independent experiments (left). (B) Effect of compound 3 on Hsp90 client protein c-Raf and heat shock proteins Hsp70 and Hsp90 in Ewing sarcoma cell line SK-N-MC after 24 h of treatment. Full images used for quantification are shown in Supporting information Fig. S9. (C) Schematic representation of the workflow applied for the in vivo evaluation of compound 3 and 17-DMAG in zebrafish larvae xenograft model of Ewing sarcoma. (D) Graphical depiction of a statistically significant inhibition of increase in relative change in tumor size in larvae treated with 1 % DMSO vs. 17-DMAG (30 µM) vs. compound 3 (10 µM); Error bars represent mean ± SEM. Statistical analysis was performed with a Mann Whitney test (**p < 0.01). |