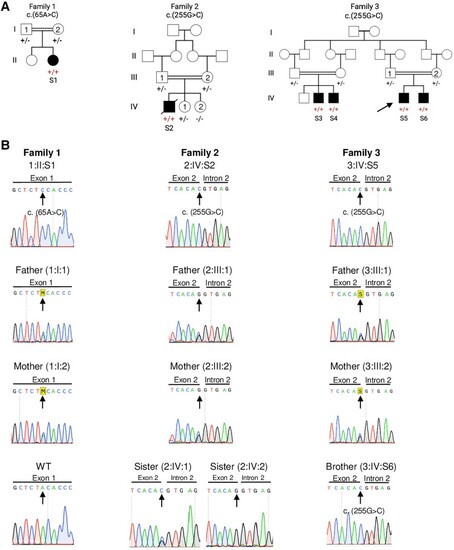
Family pedigrees and details of PTPMT1 variants. (A) Pedigrees of the three unrelated families showing consanguinity (double horizontal lines). Affected subjects (Subjects S1–S6) are represented by filled circles for females and filled squares for males. Arrow indicates proband (Subject S5) of Family 3. (B) Chromatograms from Sanger sequencing of PTPMT1 (NM_175732.3) genotypes for probands, parents and siblings of Families 1–3.
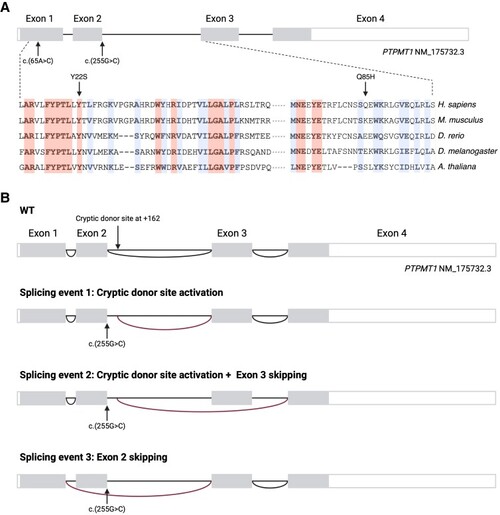
PTPMT1 variants and gene structure. (A) Schematic representation of the PTPMT1 gene showing the localization of variants c.65A>C and c.255G>C and their effects on protein sequence. PTPMT1 protein sequences alignment, indicating identical and highly conserved residues. (B) RNA-sequencing analysis of the PTPMT1 c.255G>C splicing variant. Schematics of normal PTPMT1 splicing (top) and the three aberrant splicing events associated with the c.255G>C variant.
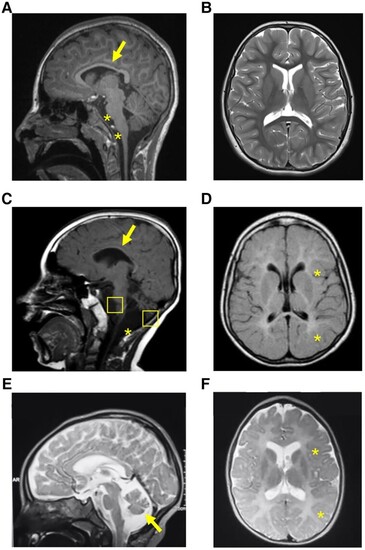
MRI sections of the brain of the three probands harbouring biallelic PTMT1 variants. (A) T1 sequence, sagittal view. Evidence of thin corpus callosum (arrow), atrophy of pons and medulla (star). (B) T2 sequence, axial view. No white or grey matter changes were observed. (C) T1 sequence, sagittal view, showing hypoplasia of corpus callosum (arrow), cerebellar and brainstem atrophy (squares), and mega cisterna magna anomaly (asterisk). (D) T1 sequence, axial view, showing supratentorial white matter signal hyperintensity in keeping with hypomyelination. (E) T2 sequence, sagittal view, showing diffuse cortical atrophy, and cerebellar atrophy (arrow). (F) T2 sequence, axial view, showing areas of hypomyelination.
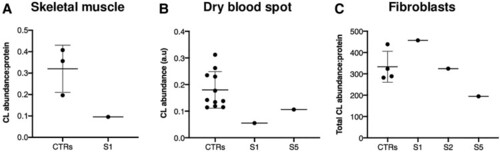
Cardiolipin content and acyl chain composition in patient-derived tissues. (A) The 72:8 cardiolipin (CL) molecular species in three healthy controls (CTRs) and Subject S1 (S1) skeletal muscle determined by mass spectrometry-based lipidome analysis. (B) Total cardiolipin levels measured in dry blood spots from 11 CTRs, Subjects S1 and S5. (C) Total cardiolipin abundance measured in primary fibroblasts from four CTRs, Subjects S1, S2 and S5. Error bars represent standard deviation; n = 3–8, where each data-point represents an independent biological sample.
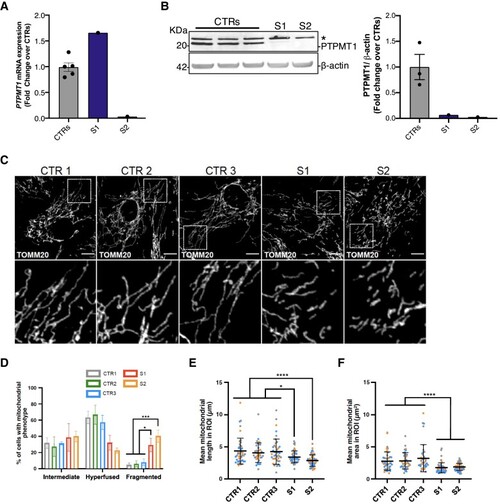
Mitochondrial morphology in patient-derived fibroblasts. (A) Relative expression of PTPMT1 mRNA in primary fibroblasts analysed by quantitative PCR. No decrease was observed in Subject S1 (S1), whereas Subject S2 (S2) showed a severe loss of PTPMT1 mRNA. Error bars represent standard error of the mean; n = 5, where each data-point represents an independent biological sample. (B) Western blot detecting the PTPMT1 protein expression in primary fibroblasts from three healthy controls (CTRs), Subjects S1 and S2. An asterisk indicates a non-specific signal. β-Actin was used as a loading control. (C) Representative confocal images of mitochondrial morphology from three healthy CTRs, Subjects S1 and S2. Mitochondria were labelled with an anti-TOMM20 antibody. Scale bar = 10 μm. (D) Quantification of mitochondrial morphology related to C. (E and F) Quantification of mitochondrial length (E) and area (F), per region of interest (ROI) (225 µm2) from D. Data are expressed as mean ± standard error of the mean (SEM) (A) or standard deviation (D–F); n = 3 independent experiments. D: Two-way ANOVA, Tukey’s multiple comparison test; E and F: unpaired Mann–Whitney U-test (two-tailed). *P < 0.05, **P < 0.01, ***P < 0.001.
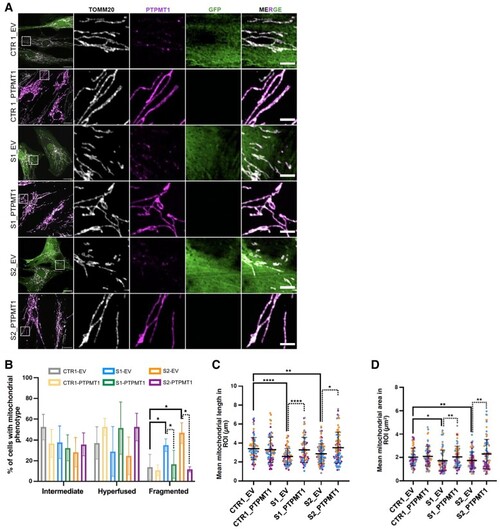
PTPMT1 expression and mitochondrial morphology in complemented patient-derived fibroblasts. (A) Representative confocal images of mitochondrial morphology and PTPMT1 expression in a healthy control (CTR1), Subject S1 (S1) and Subject S2 (S2) before and after transduction with pLenti6.3/V5-DEST-GFP (empty vector, EV) or pLenti6.3/V5-DEST vector expressing wild-type PTPMT1. Mitochondria and PTPMT1 were labelled with anti-TOMM20 and anti-PTPMT1 antibodies, respectively. Scale bar = 10 μm. (B) Quantification of mitochondrial morphology related to A. (C and D) Quantification of mitochondrial length (C) and area (D) per region of interest (ROI) (225 µm2) from B. Data are expressed as mean ± standard deviation; n = 4 independent experiments. B: Two-way ANOVA, Tukey’s multiple comparison test; C and D: unpaired Mann–Whitney U-test (two-tailed). *P < 0.05, **P < 0.01, ***P < 0.001.
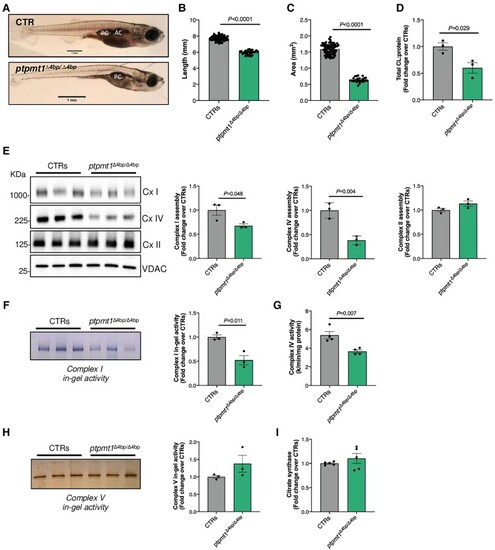
Morphological, cardiolipin content, and oxidative phosphorylation complex analysis of ptpmt1 knockout zebrafish. (A) Representative image of ptpmt1+/+ (CTR) and ptpmtΔ4bp/Δ4bp. (B) Quantification of zebrafish body length. (C) Quantification of zebrafish head area. (D) Total cardiolipin (CL) levels measured by mass spectrometry-based lipidome analysis. (E) Western blot analysis of blue-native polyacrylamide gels loaded with 23.8 μg of protein extracted from a pool of two CTRs and 10 ptpmtΔ4bp/Δ4bp zebrafish samples. (F) In-gel activity of Complex (Cx) I in a polyacrylamide blue-native gel loaded with 35.7 μg of protein extracted from a pool of two CTRs and 10 ptpmtΔ4bp/Δ4bp zebrafish samples. (G) Spectrophotometric enzyme activity of Complex IV in CTRs and 10 ptpmtΔ4bp/Δ4bp zebrafish samples. (H) In-gel activity of Complex V in a polyacrylamide clear-native gel loaded with 11.4 μg of protein extracted from a pool of two CTRs and 10 ptpmtΔ4bp/Δ4bp zebrafish samples. (I) Citrate synthase activity measured in CTRs and ptpmtΔ4bp/Δ4bp. All measures were performed at 19 days post fertilization (dpf). The mutant allele is referred to as ptpmt1Δ4bp. Control groups (CTRs) were obtained by pooling together ptpmt1+/+ and ptpmt+/Δ4bp samples. Error bars represent standard error of the mean, n = 3–71, where each data-point represents an independent biological sample. Significance values are shown for t-test compared to CTRs.
Acknowledgments
This image is the copyrighted work of the attributed author or publisher, and
ZFIN has permission only to display this image to its users.
Additional permissions should be obtained from the applicable author or publisher of the image.
Full text @ Brain
Your Input Welcome
Thank you for submitting comments. Your input has been emailed to ZFIN curators who may contact you if
additional information is required.
Oops. Something went wrong. Please try again later.