|
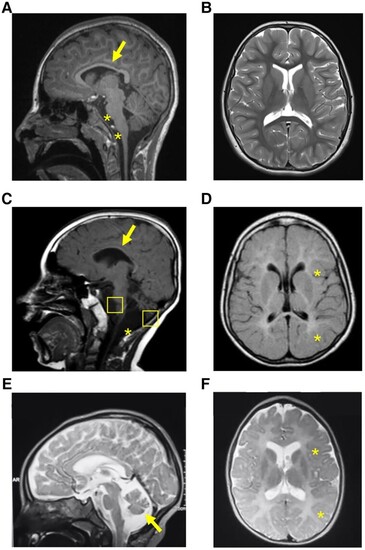
MRI sections of the brain of the three probands harbouring biallelic PTMT1 variants. (A) T1 sequence, sagittal view. Evidence of thin corpus callosum (arrow), atrophy of pons and medulla (star). (B) T2 sequence, axial view. No white or grey matter changes were observed. (C) T1 sequence, sagittal view, showing hypoplasia of corpus callosum (arrow), cerebellar and brainstem atrophy (squares), and mega cisterna magna anomaly (asterisk). (D) T1 sequence, axial view, showing supratentorial white matter signal hyperintensity in keeping with hypomyelination. (E) T2 sequence, sagittal view, showing diffuse cortical atrophy, and cerebellar atrophy (arrow). (F) T2 sequence, axial view, showing areas of hypomyelination.
|