IMAGE

Figure 7

ID
ZDB-IMAGE-250204-95
Source
Figures for Falabella et al., 2024
Image
Figure Caption

Figure 7

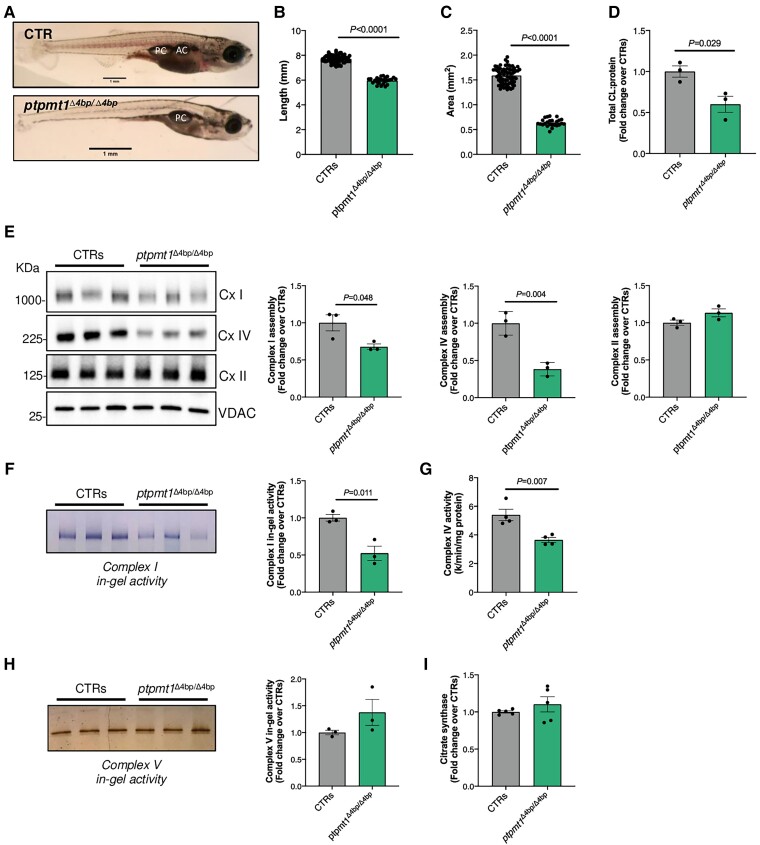
Morphological, cardiolipin content, and oxidative phosphorylation complex analysis of ptpmt1 knockout zebrafish. (A) Representative image of ptpmt1+/+ (CTR) and ptpmtΔ4bp/Δ4bp. (B) Quantification of zebrafish body length. (C) Quantification of zebrafish head area. (D) Total cardiolipin (CL) levels measured by mass spectrometry-based lipidome analysis. (E) Western blot analysis of blue-native polyacrylamide gels loaded with 23.8 μg of protein extracted from a pool of two CTRs and 10 ptpmtΔ4bp/Δ4bp zebrafish samples. (F) In-gel activity of Complex (Cx) I in a polyacrylamide blue-native gel loaded with 35.7 μg of protein extracted from a pool of two CTRs and 10 ptpmtΔ4bp/Δ4bp zebrafish samples. (G) Spectrophotometric enzyme activity of Complex IV in CTRs and 10 ptpmtΔ4bp/Δ4bp zebrafish samples. (H) In-gel activity of Complex V in a polyacrylamide clear-native gel loaded with 11.4 μg of protein extracted from a pool of two CTRs and 10 ptpmtΔ4bp/Δ4bp zebrafish samples. (I) Citrate synthase activity measured in CTRs and ptpmtΔ4bp/Δ4bp. All measures were performed at 19 days post fertilization (dpf). The mutant allele is referred to as ptpmt1Δ4bp. Control groups (CTRs) were obtained by pooling together ptpmt1+/+ and ptpmt+/Δ4bp samples. Error bars represent standard error of the mean, n = 3–71, where each data-point represents an independent biological sample. Significance values are shown for t-test compared to CTRs.

Acknowledgments
This image is the copyrighted work of the attributed author or publisher, and ZFIN has permission only to display this image to its users. Additional permissions should be obtained from the applicable author or publisher of the image. Full text @ Brain