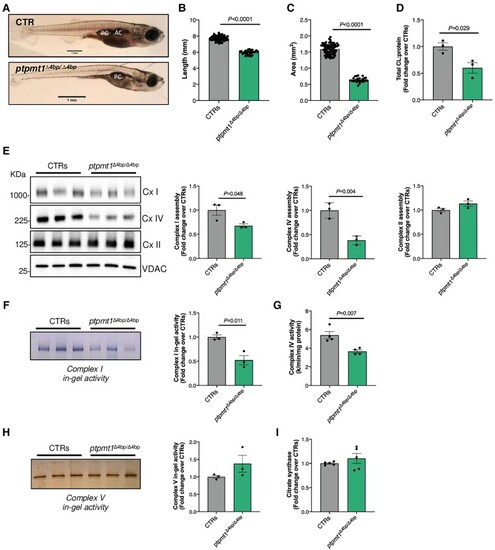
Morphological, cardiolipin content, and oxidative phosphorylation complex analysis of ptpmt1 knockout zebrafish. (A) Representative image of ptpmt1+/+ (CTR) and ptpmtΔ4bp/Δ4bp. (B) Quantification of zebrafish body length. (C) Quantification of zebrafish head area. (D) Total cardiolipin (CL) levels measured by mass spectrometry-based lipidome analysis. (E) Western blot analysis of blue-native polyacrylamide gels loaded with 23.8 μg of protein extracted from a pool of two CTRs and 10 ptpmtΔ4bp/Δ4bp zebrafish samples. (F) In-gel activity of Complex (Cx) I in a polyacrylamide blue-native gel loaded with 35.7 μg of protein extracted from a pool of two CTRs and 10 ptpmtΔ4bp/Δ4bp zebrafish samples. (G) Spectrophotometric enzyme activity of Complex IV in CTRs and 10 ptpmtΔ4bp/Δ4bp zebrafish samples. (H) In-gel activity of Complex V in a polyacrylamide clear-native gel loaded with 11.4 μg of protein extracted from a pool of two CTRs and 10 ptpmtΔ4bp/Δ4bp zebrafish samples. (I) Citrate synthase activity measured in CTRs and ptpmtΔ4bp/Δ4bp. All measures were performed at 19 days post fertilization (dpf). The mutant allele is referred to as ptpmt1Δ4bp. Control groups (CTRs) were obtained by pooling together ptpmt1+/+ and ptpmt+/Δ4bp samples. Error bars represent standard error of the mean, n = 3–71, where each data-point represents an independent biological sample. Significance values are shown for t-test compared to CTRs.
|
