
IMAGE
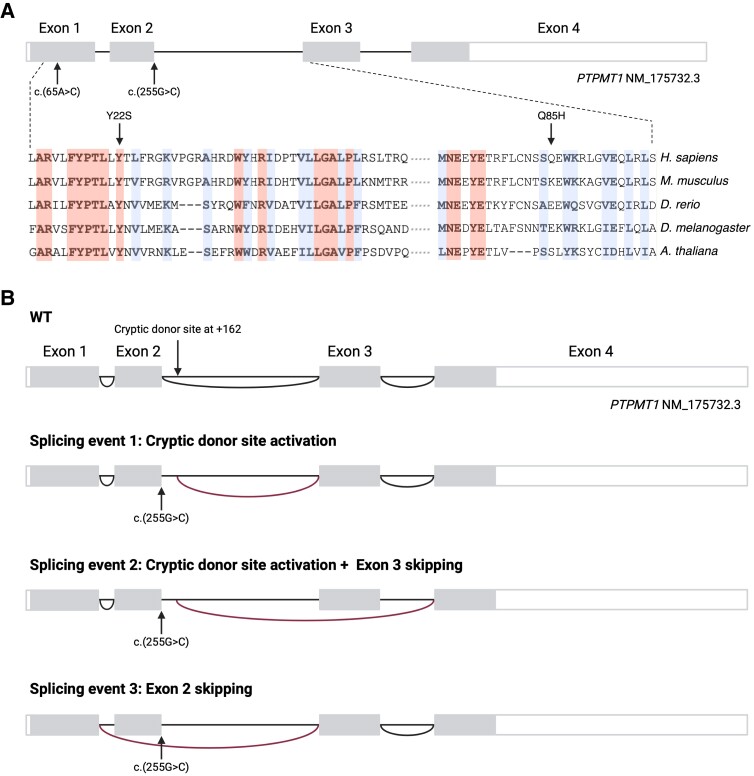
Figure 2
- ID
- ZDB-IMAGE-250204-90
- Publication
- Falabella et al., 2024 - Biallelic PTPMT1 variants disrupt cardiolipin metabolism and lead to a neurodevelopmental syndrome
- All Figures
- Figures for Falabella et al., 2024
Image
|
Figure Caption
Figure 2
Acknowledgments
This image is the copyrighted work of the attributed author or publisher, and
ZFIN has permission only to display this image to its users.
Additional permissions should be obtained from the applicable author or publisher of the image.
Full text @ Brain