|
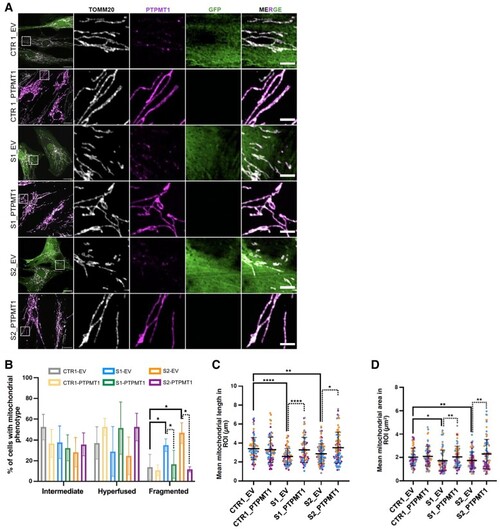
PTPMT1 expression and mitochondrial morphology in complemented patient-derived fibroblasts. (A) Representative confocal images of mitochondrial morphology and PTPMT1 expression in a healthy control (CTR1), Subject S1 (S1) and Subject S2 (S2) before and after transduction with pLenti6.3/V5-DEST-GFP (empty vector, EV) or pLenti6.3/V5-DEST vector expressing wild-type PTPMT1. Mitochondria and PTPMT1 were labelled with anti-TOMM20 and anti-PTPMT1 antibodies, respectively. Scale bar = 10 μm. (B) Quantification of mitochondrial morphology related to A. (C and D) Quantification of mitochondrial length (C) and area (D) per region of interest (ROI) (225 µm2) from B. Data are expressed as mean ± standard deviation; n = 4 independent experiments. B: Two-way ANOVA, Tukey’s multiple comparison test; C and D: unpaired Mann–Whitney U-test (two-tailed). *P < 0.05, **P < 0.01, ***P < 0.001.
|