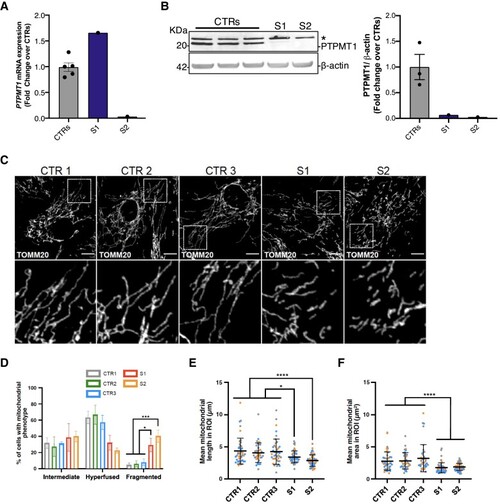
Mitochondrial morphology in patient-derived fibroblasts. (A) Relative expression of PTPMT1 mRNA in primary fibroblasts analysed by quantitative PCR. No decrease was observed in Subject S1 (S1), whereas Subject S2 (S2) showed a severe loss of PTPMT1 mRNA. Error bars represent standard error of the mean; n = 5, where each data-point represents an independent biological sample. (B) Western blot detecting the PTPMT1 protein expression in primary fibroblasts from three healthy controls (CTRs), Subjects S1 and S2. An asterisk indicates a non-specific signal. β-Actin was used as a loading control. (C) Representative confocal images of mitochondrial morphology from three healthy CTRs, Subjects S1 and S2. Mitochondria were labelled with an anti-TOMM20 antibody. Scale bar = 10 μm. (D) Quantification of mitochondrial morphology related to C. (E and F) Quantification of mitochondrial length (E) and area (F), per region of interest (ROI) (225 µm2) from D. Data are expressed as mean ± standard error of the mean (SEM) (A) or standard deviation (D–F); n = 3 independent experiments. D: Two-way ANOVA, Tukey’s multiple comparison test; E and F: unpaired Mann–Whitney U-test (two-tailed). *P < 0.05, **P < 0.01, ***P < 0.001.
|
