
- Title
-
Genetic and Environmental Factors Co-Contributing to Behavioral Abnormalities in adnp/adnp2 Mutant Zebrafish
- Authors
- Wang, Y., Sun, X., Xiong, B., Duan, M., Sun, Y.
- Source
- Full text @ Int. J. Mol. Sci.
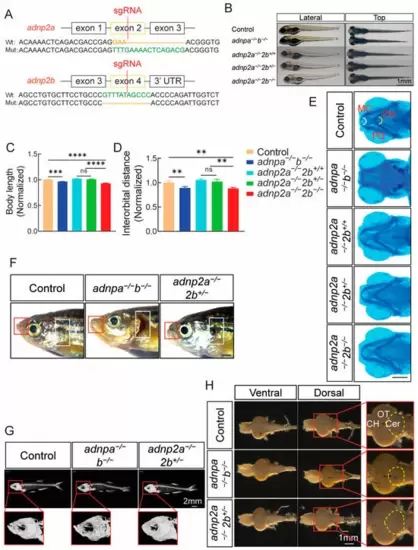
Generation and characterization of adnp2 mutants. (A) The design of CRISPR/Cas9 gRNA targeting and the genotyping results. Upper: the adnp2a gene; lower: the adnp2b gene. (B) Morphology of the larvae of the indicated group at 4 dpf. Lateral: lateral view; top: dorsal view. Bar = 1 mm. (C,D) Relative body length and interorbital distance based on the panel B (n = 20 per group). Data shown were normalized, and the control was set as 1. (E) Alcian blue staining images of the larvae of the indicated groups at 4 dpf, showing the angle of Meckel’s cartilage (n = 20 per group). MC: Meckel’s cartilage; PQ: palatoquadrate; CH: ceratohyal cartilage. Bar = 0.2 mm. (F) Morphology of control, adnpa−/−; adnpb−/− and adnp2a−/−; adnp2b+/− adult zebrafish (at 4 mpf, all male). The red box showed the protruded lips, and the white box showed the deficits of the gills (n = 27 per group). Bar = 1 mm. (G) CT images (n = 6 per group) showed the head of control, adnpa−/−; adnpb−/−, and adnp2a−/−; adnp2b+/− adults. Bar = 2 mm. (H) Anatomical brain images of control, adnpa−/−; adnpb−/−, and adnp2a−/−; adnp2b+/− adults. Ventral: ventral view; dorsal: dorsal view. The dotted yellow lines indicated the area of the cerebellum. CH: cerebral hemisphere; OT: optic tectum; Cer: cerebellum. Bar = 1 mm. Data are presented as mean ± SEM; ** p < 0.01, *** p < 0.001, **** p < 0.0001. ns: no significance. |

Impaired locomotor activity of mutant larvae in the open field test. (A) Locomotor activity of indicated larvae at 7 dpf (n = 68 per group). The average distance moved within each 1 min bin under constant illumination condition was plotted. The Y axis shows the normalized distance (millimeters) travelled by larvae in each 1 min bin. (B) Quantification of panel A. (C) Representative swimming trajectories of individual larvae of the indicated groups in the thigmotaxis test. The left side is a diagram of the observation area, the inner concentric circles are the “center zone”, and the outer concentric circles are the “periphery zone”. (D) Graph showing the time (second) in center zone spent by the indicated larvae types. (E) Light/dark test of the indicated groups at 7 dpf (n = 48 per group). The activity was recorded for 20 min, after 40 min of acclimation. Shown were based on a 30 min light/dark test, with three-min light/dark cycles (D1/L1, D2/L2, and D3/L3). D1: dark interval 1; L1: light interval 1. The average distance moved within each 1 min bin under light or dark conditions was plotted. Grey color was used to highlight the dark intervals. (F) Quantification of panel E. The Y axis shows the normalized distance (millimeters) travelled by larvae in each 1 min bin. Data are presented as mean ± SEM; * p < 0.05, ** p < 0.01, *** p < 0.001, **** p < 0.0001. ns: no significance. |

Abnormal locomotor and thigmotaxis activities of adult mutants. (A) Graph showing the average velocity of individual control, adnpa−/−; adnpb−/−, and adnp2a−/−; adnp2b+/− adults (n = 28 per group) at 4 mpf, in a total 30 min period. (B) Graph showed the average total distance travelled by control, adnpa−/−; adnpb−/−, and adnp2a−/−; adnp2b+/− adults. (C) The representative traces of movements of control, adnpa−/−; adnpb−/−, and adnp2a−/−; adnp2b+/− adults. (D) Graph showing the time (second) spent in center zone of the indicated groups. (E) Representative swimming trajectories showing the stereotypical and repetitive behaviors of adnpa−/−; adnpb−/− adults. (F) quantification of panel (E). (G) Heat map visualization of zebrafish trajectories in the light/dark box test, in a total of 10 min period (n = 26 per group). (H) Graph showing the frequency of entering into light zone. (I) Heat map visualization of zebrafish trajectories in the novel tank test, in 10 min period (n = 30 per group). (J) Graph showing time spent in top zone of the indicated groups. Data are presented as mean ± SEM; * p < 0.05, ** p < 0.01, **** p < 0.0001. ns: no significance. |
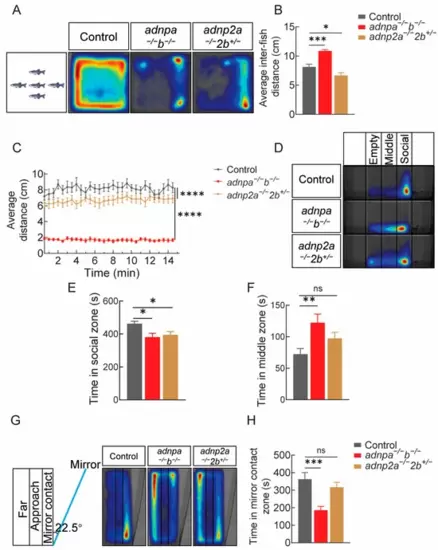
Impaired social preference behaviors in adult mutants. (A) Heat map visualization of zebrafish trajectories in the shoaling test of 4 mpf adults (12 groups, 5 zebrafish per group), based on 15 min. (B) Graph showing the average inter-fish distance. (C) Diagram showing the average distance moved by each group. (D) Heat map visualization of zebrafish trajectories in the three-tank test, in a total 10 min period (n = 26 per group). (E,F) Graph showing the time (second) spent in social and middle zones. (G) Heat map visualization of zebrafish trajectories in the mirror test (n = 25 per group). (H) Graph showing the time (second) spent in mirror contact zone. Data are presented as mean ± SEM; * p < 0.05, ** p < 0.01, *** p < 0.001, **** p < 0.0001. ns: no significance. |

Differentially expressed genes identified by RNA-seq analysis. (A) KEGG terms of the downregulated DEGs of control and adnpa−/−; adnpb−/− larval brain at 7 dpf. (B) KEGG terms of the downregulated DEGs of control and adnp2a−/−; adnp2b−/− larval brain at 7 dpf. (C) Cluster heat map of circadian rhythm, early response, sex hormones, and neural regeneration pathways. (D) Results of in situ hybridization for synaptic-associated genes. (E) Corresponding to the qRT-PCR results in Figure (C,D). Data are presented as mean ± SEM; * p < 0.05, ** p < 0.01, *** p < 0.001, **** p < 0.0001, ns: no significance. |
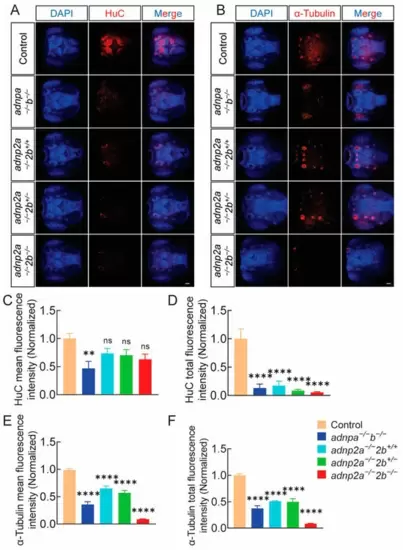
The levels of HuC and α-tubulin proteins in adnp and adnp2 mutant larvae were significantly decreased. (A) HuC IF results in larval brains. (n = 11 per group). (B) α-tubulin IF results in larval brains (n = 9 for each genotype); 3 days; bar = 200 μm. (C,D) Mean fluorescence intensity and total fluorescence intensity of HuC red fluorescence signal. (E,F) Mean fluorescence intensity and total fluorescence intensity of α-tubulin red fluorescence signal. Data are presented as mean ± SEM; ** p < 0.01, **** p < 0.0001, ns indicates no significance. |
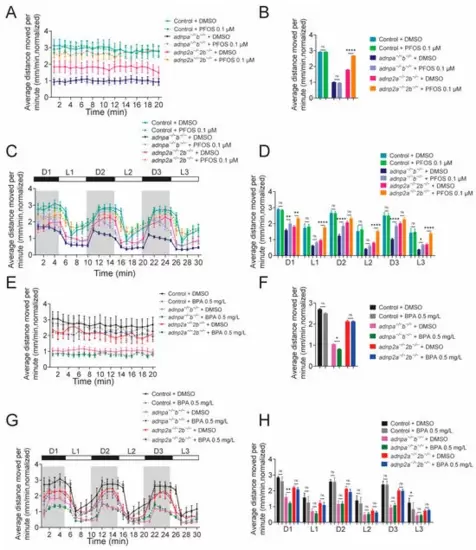
PFOS and BPA aggregate abnormal behaviors of adnp/adnp2 mutants. (A) Average distance moved per minute of the indicated larvae with and without PFOS, under constant illumination conditions. (B) Quantification of panel A (n = 30 per group). (C) Average distance moved per minute of the indicated larvae with and without PFOS, under light/dark shift condition. (D) Quantification of panel (C) (n = 30 per group). (E) Average distance moved per minute of the indicated larvae with and without BPA, under light/dark shift conditions. (F) Quantification of panel (E) (n = 30 per group). (G) Average distance moved per minute of the indicated larvae with and without BPA under light/dark shift conditions. (H) Quantification of panel (G) (n = 30 per group). Data are presented as mean ± SEM; * p < 0.05, ** p < 0.01, **** p < 0.0001, ns represents no significance. |