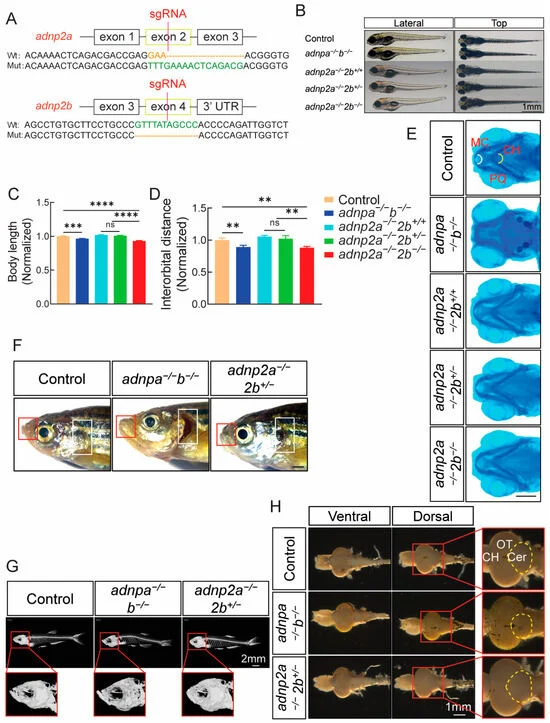
Fig. 1 Generation and characterization of adnp2 mutants. (A) The design of CRISPR/Cas9 gRNA targeting and the genotyping results. Upper: the adnp2a gene; lower: the adnp2b gene. (B) Morphology of the larvae of the indicated group at 4 dpf. Lateral: lateral view; top: dorsal view. Bar = 1 mm. (C,D) Relative body length and interorbital distance based on the panel B (n = 20 per group). Data shown were normalized, and the control was set as 1. (E) Alcian blue staining images of the larvae of the indicated groups at 4 dpf, showing the angle of Meckel’s cartilage (n = 20 per group). MC: Meckel’s cartilage; PQ: palatoquadrate; CH: ceratohyal cartilage. Bar = 0.2 mm. (F) Morphology of control, adnpa−/−; adnpb−/− and adnp2a−/−; adnp2b+/− adult zebrafish (at 4 mpf, all male). The red box showed the protruded lips, and the white box showed the deficits of the gills (n = 27 per group). Bar = 1 mm. (G) CT images (n = 6 per group) showed the head of control, adnpa−/−; adnpb−/−, and adnp2a−/−; adnp2b+/− adults. Bar = 2 mm. (H) Anatomical brain images of control, adnpa−/−; adnpb−/−, and adnp2a−/−; adnp2b+/− adults. Ventral: ventral view; dorsal: dorsal view. The dotted yellow lines indicated the area of the cerebellum. CH: cerebral hemisphere; OT: optic tectum; Cer: cerebellum. Bar = 1 mm. Data are presented as mean ± SEM; ** p < 0.01, *** p < 0.001, **** p < 0.0001. ns: no significance.
Image
Figure Caption
Acknowledgments
This image is the copyrighted work of the attributed author or publisher, and
ZFIN has permission only to display this image to its users.
Additional permissions should be obtained from the applicable author or publisher of the image.
Full text @ Int. J. Mol. Sci.

