Fig. 1
- ID
- ZDB-FIG-240916-30
- Publication
- Wang et al., 2024 - Genetic and Environmental Factors Co-Contributing to Behavioral Abnormalities in adnp/adnp2 Mutant Zebrafish
- Other Figures
- All Figure Page
- Back to All Figure Page
|
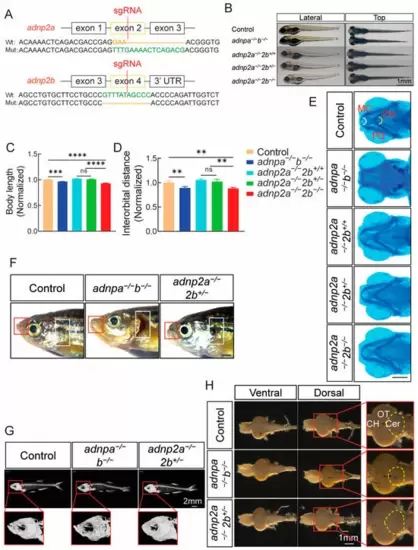
Generation and characterization of adnp2 mutants. (A) The design of CRISPR/Cas9 gRNA targeting and the genotyping results. Upper: the adnp2a gene; lower: the adnp2b gene. (B) Morphology of the larvae of the indicated group at 4 dpf. Lateral: lateral view; top: dorsal view. Bar = 1 mm. (C,D) Relative body length and interorbital distance based on the panel B (n = 20 per group). Data shown were normalized, and the control was set as 1. (E) Alcian blue staining images of the larvae of the indicated groups at 4 dpf, showing the angle of Meckel’s cartilage (n = 20 per group). MC: Meckel’s cartilage; PQ: palatoquadrate; CH: ceratohyal cartilage. Bar = 0.2 mm. (F) Morphology of control, adnpa−/−; adnpb−/− and adnp2a−/−; adnp2b+/− adult zebrafish (at 4 mpf, all male). The red box showed the protruded lips, and the white box showed the deficits of the gills (n = 27 per group). Bar = 1 mm. (G) CT images (n = 6 per group) showed the head of control, adnpa−/−; adnpb−/−, and adnp2a−/−; adnp2b+/− adults. Bar = 2 mm. (H) Anatomical brain images of control, adnpa−/−; adnpb−/−, and adnp2a−/−; adnp2b+/− adults. Ventral: ventral view; dorsal: dorsal view. The dotted yellow lines indicated the area of the cerebellum. CH: cerebral hemisphere; OT: optic tectum; Cer: cerebellum. Bar = 1 mm. Data are presented as mean ± SEM; ** p < 0.01, *** p < 0.001, **** p < 0.0001. ns: no significance. |

