
- Title
-
The Accordion Zebrafish tq206 Mutant in the Assessment of a Novel Pharmaceutical Approach to Brody Myopathy
- Authors
- Akyürek, E.E., Greco, F., Tesoriero, C., Dalla Barba, F., Carotti, M., Gorni, G., Sandonà, D., Vettori, A., Sacchetto, R.
- Source
- Full text @ Int. J. Mol. Sci.
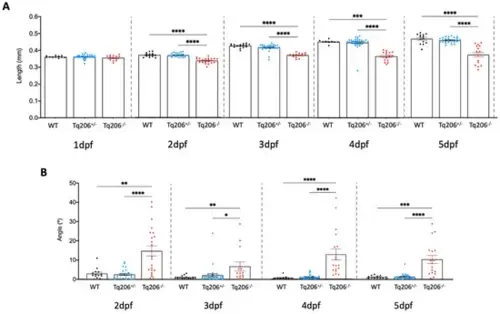
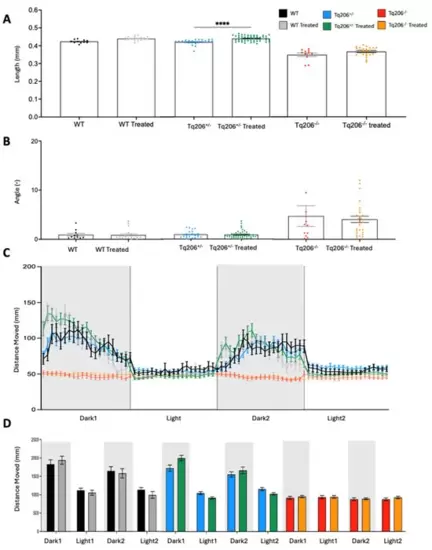
Morphometric assessment of Tq206+/−, Tq206−/− and wild-type (WT) embryos/larvae. (A) Total body length differences between the experimental groups at 1, 2, 3, 4, and 5 days post-fertilization (dpf). (B) The tail curvature angle was measured from 2 dpf to 5 dpf of WT, Tq206+/− and Tq206−/− animals. Comparative analysis between groups was made with one-way analysis of variance (ANOVA). Nonparametric data were analyzed using the Kruskal–Wallis test, followed by Dunn’s post hoc test. Data are presented as mean ± SEM. *, p ≤ 0.05; **, p ≤ 0.01; ***, p ≤ 0.001; ****, p ≤ 0.0001. |
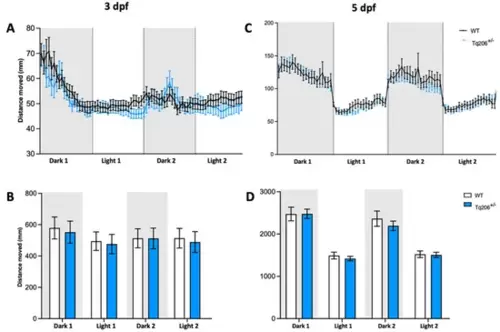
Behavioral assessment of Tq206+/− and wild-type (WT) at different days post-fertilization (dpf). (A,B) Qualitative (A) and quantitative (B) analyses of the distance moved by 3-dpf-old Tq206+/− (light blue line/bars) and WT (black line/white bars). Embryos underwent a period of 30 min of acclimatization followed by two alternating cycles of 10 min of darkness and 10 min of illumination, with the dark phases being indicated by grey boxes. (C) Distance moved by 5-dpf-old Tq206+/− and WT embryos, and (D) their quantitative analyses. Data are presented as the mean ± SEM. Statistical analysis was conducted using a 2-way analysis of variance (ANOVA) with a Šidák’s multiple comparisons test. |
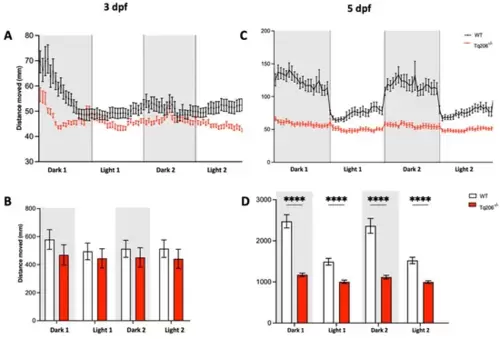
Behavioral assessment of Tq206−/− and wild-type (WT) at different days post-fertilization (dpf). (A,B) Qualitative (A) and quantitative (B) analysis of the distance moved by 3-dpf-old Tq206−/− (red line/bars) and WT (black line/white bars). Embryos underwent a period of 30 min of acclimatization followed by two alternating cycles of 10 min of darkness and 10 min of illumination, with the dark phases being indicated by grey boxes. (C) Distance moved by 5-dpf-old Tq206−/− and WT embryos, and (D) their quantitative analyses. Data are presented as the mean ± SEM. Statistical analysis was conducted using a 2-way analysis of variance (ANOVA) with a Šidák’s multiple comparisons test. **** p < 0.0001. |
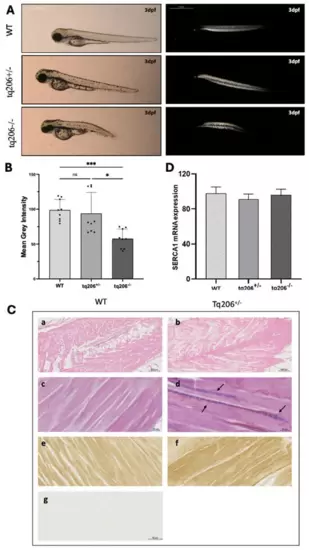
Muscle fiber integrity, the skeletal muscle histology and SERCA1 mRNA expression levels assessments. (A,B) Representative images (A) and quantification of birefringence (B) of wild-type (WT), Tq206+/−, and Tq206−/− embryos are presented. Scale bar: 1 mm. Quantitative data are presented as mean ± SEM (Kruskal-Wallis test followed by Dunn’s post hoc test, ns, non-significant; *, p ≤ 0.05; *** p ≤ 0.001). (C) Hematoxylin & Eosin (panels (a,b), scale bar 500 µm), Azan-Mallory staining (panels (c,d), scale bar 50 µm), and SERCA1 immunostaining (panels (e,f), scale bar 20 µm) in muscle sagittal sections of WT (a,c,e,g) and Tq206+/− (b,d,f) zebrafish. In panel d, arrows indicate fibrotic tissue (colored in blue) presence. Negative control of the immunohistochemistry is shown in (g). (D) SERCA1 mRNA expression levels in WT, Tq206+/− and Tq206−/−, were quantified by Real Time RT-PCR. Data are presented as mean ± SEM. |
Morphometric (A,B) and behavioral assessment (C,D) of wild−type (WT), Tq206+/−, and Tq206−/− zebrafish embryos after 48 h treatment with 0.05 μM CFTR corrector C17. (A) Total body length differences of treated and untreated WT, Tq206+/− and Tq206−/− zebrafish embryos. (B) Tail curvature angle measurements comparison with treated and untreated WT, Tq206+/− and Tq206−/− zebrafish embryos. Qualitative (C) and quantitative (D) analyses of the distance moved by treated and untreated WT, Tq206+/− and Tq206−/− zebrafish embryos. Embryos underwent 30 min of acclimatization followed by two alternating cycles of 10 min of darkness and 10 min of illumination, with the dark phases being indicated by grey boxes. All zebrafish embryos were 3 dpf old, and the treatment group received treatment of CFTR corrector C17 at 0.05 μM concentration for 48 h. Quantitative data are presented as mean ± SEM. Statistical analysis was performed by the Mann-Whitney test; **** p < 0.0001. |
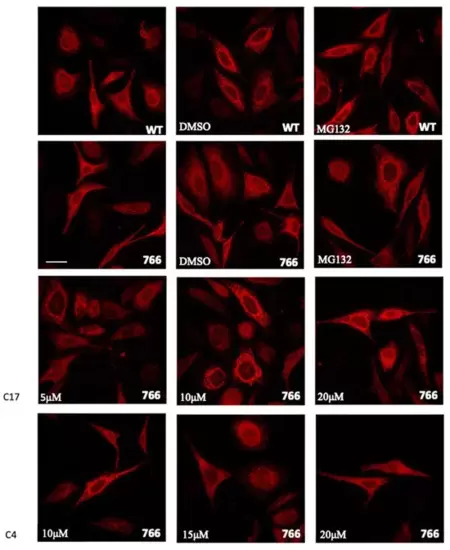
Cellular expression and localization of WT and mutant SERCA1 protein in HeLa cells. Cells were transfected with WT or with S766F mutated SERCA1 cDNAs, as indicated. Sixteen hours after transfection, MG132 (10 μM final concentration dissolved in DMSO), DMSO (its vehicle 0,1%) and different concentrations of C17 (5 μM, 10 μM, 20 μM) or C4 (10 μM, 15 μM, 20 μM) CFTR correctors, were added and cells were incubated for 8h. Transfected and treated cells were immunolabelled with monoclonal antibodies to SERCA1 and then incubated with the Alexa 568 red fluorescence secondary antibody. Images were recorded at the same setting conditions and magnification (scale bar 50 µm). |
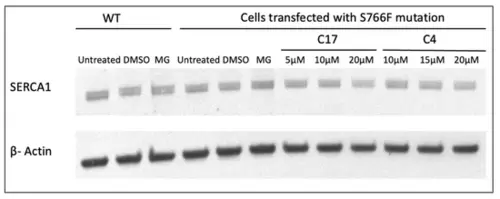
Representative Western blot showing the expression level analysis of WT, S766F mutant SERCA1 proteins after incubation with proteasome inhibitor MG132 and CFTR correctors at different concentrations. HeLa cells transfected with WT and S766F SERCA1 cDNAs were treated with the proteasome inhibitor MG132 (10 µM) or its vehicle DMSO (0.1%) and S766F mutants were also exposed to different concentrations of C17 and C4 CFTR correctors. An equal quantity of protein from total cell lysates was separated by SDS-PAGE and subjected to immunoblot analysis with antibodies specific to SERCA1 and 42 kDa beta-actin, used as loading control. |