
|
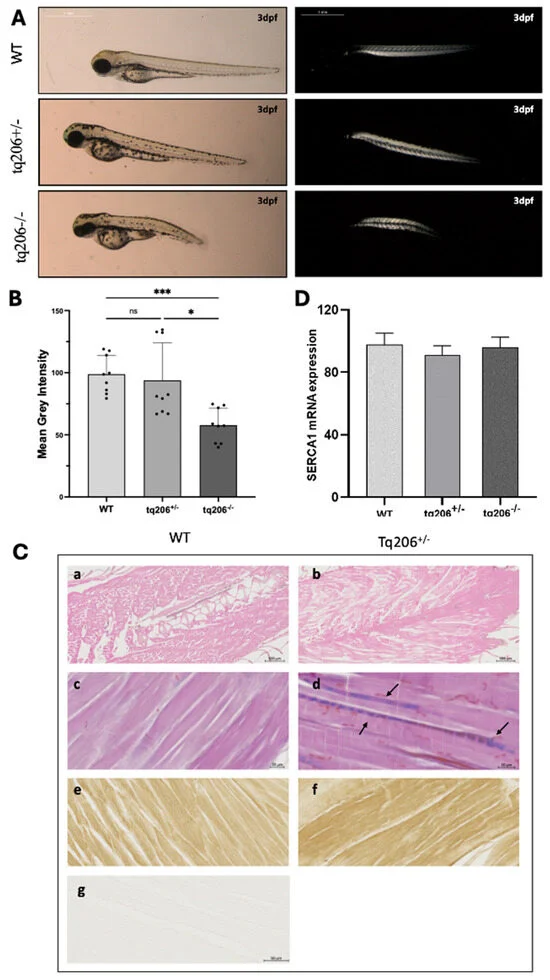
Fig. 4 Muscle fiber integrity, the skeletal muscle histology and SERCA1 mRNA expression levels assessments. (A,B) Representative images (A) and quantification of birefringence (B) of wild-type (WT), Tq206+/−, and Tq206−/− embryos are presented. Scale bar: 1 mm. Quantitative data are presented as mean ± SEM (Kruskal-Wallis test followed by Dunn’s post hoc test, ns, non-significant; *, p ≤ 0.05; *** p ≤ 0.001). (C) Hematoxylin & Eosin (panels (a,b), scale bar 500 µm), Azan-Mallory staining (panels (c,d), scale bar 50 µm), and SERCA1 immunostaining (panels (e,f), scale bar 20 µm) in muscle sagittal sections of WT (a,c,e,g) and Tq206+/− (b,d,f) zebrafish. In panel d, arrows indicate fibrotic tissue (colored in blue) presence. Negative control of the immunohistochemistry is shown in (g). (D) SERCA1 mRNA expression levels in WT, Tq206+/− and Tq206−/−, were quantified by Real Time RT-PCR. Data are presented as mean ± SEM.