
|
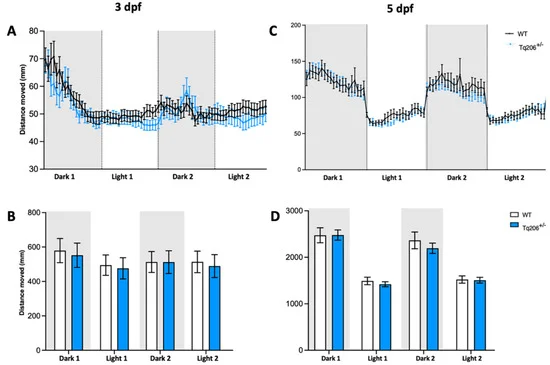
Fig. 2 Behavioral assessment of Tq206+/− and wild-type (WT) at different days post-fertilization (dpf). (A,B) Qualitative (A) and quantitative (B) analyses of the distance moved by 3-dpf-old Tq206+/− (light blue line/bars) and WT (black line/white bars). Embryos underwent a period of 30 min of acclimatization followed by two alternating cycles of 10 min of darkness and 10 min of illumination, with the dark phases being indicated by grey boxes. (C) Distance moved by 5-dpf-old Tq206+/− and WT embryos, and (D) their quantitative analyses. Data are presented as the mean ± SEM. Statistical analysis was conducted using a 2-way analysis of variance (ANOVA) with a Šidák’s multiple comparisons test.