
- Title
-
The role of cilia in the development, survival, and regeneration of hair cells
- Authors
- Boldizar, H., Friedman, A., Stanley, T., Padilla, M., Galdieri, J., Sclar, A., Stawicki, T.M.
- Source
- Full text @ Biol. Open
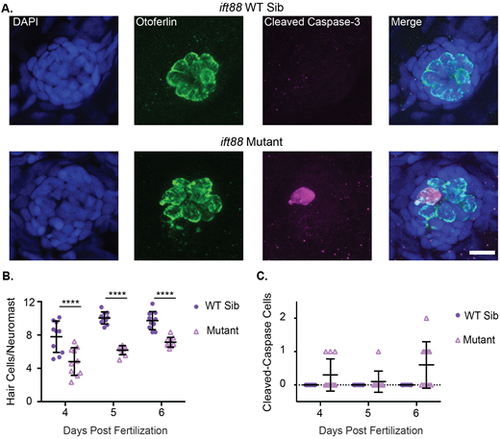
ift88 mutants show decreased hair cell number and hair cells undergoing apoptosis. (A) Representative images of neuromasts from ift88 wild-type siblings (top) and ift88 mutants (bottom) at 6 dpf. Nuclei are labeled in blue with DAPI, hair cells in green with the Otoferlin antibody and cells undergoing apoptosis in magenta with the cleaved caspase-3 antibody. Scale bar: 10 µm. (B) Quantification of hair cells/neuromasts in ift88 wild-type siblings and mutants at 4, 5 and 6 dpf. Genotype and age were significant sources of variation by two-way ANOVA (P<0.0001), but the interaction between the two variables was not (P=0.2377). ****=P<0.001 by Šídák's multiple comparisons test comparing the wild-type siblings and mutants at the different ages. n=10 for each group. (C) Quantification of the total number of cleaved caspase-3 positive hair cells in the nine neuromasts of the posterior lateral line in ift88 wild-type siblings and mutants at 4, 5 and 6 dpf. Genotype was a significant source of variation by two-way ANOVA (P=0.001) whereas age (P=0.1089) and the interaction between the two variables (P=0.0189) were not. n=10 for each group. |
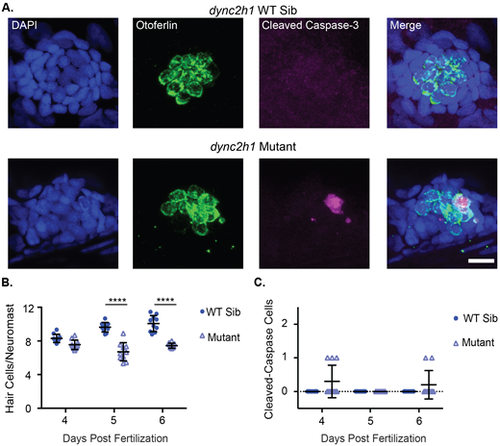
dync2h1 mutants show decreased hair cell number and hair cells undergoing apoptosis. (A) Representative images of neuromasts from dync2h1 wild-type siblings (top) and dync2h1 mutants (bottom) at 6 dpf. Nuclei are labeled in blue with DAPI, hair cells in green with the Otoferlin antibody and cells undergoing apoptosis in magenta with the cleaved caspase-3 antibody. Scale bar=10 µm. (B) Quantification of hair cells/neuromasts in dync2h1 wild-type siblings and mutants at 4, 5 and 6 dpf. Genotype (P<0.0001), age (P=0.0003), and the interaction between the two variables (P<0.0001) were significant sources of variation by 2-way ANOVA. ****=P<0.001 by Šídák's multiple comparisons test comparing the wild-type siblings and mutants at the different ages. n=10 for each group. (C) Quantification of the total number of cleaved caspase-3 positive hair cells in the 9 neuromasts of the posterior lateral line in dync2h1 wild-type siblings and mutants at 4, 5 and 6 dpf. Genotype was a significant source of variation by 2-way ANOVA (P=0.0169) whereas age (P=0.1918) and the interaction between the two variables (P=0.1918) were not. n=10 for each group. |
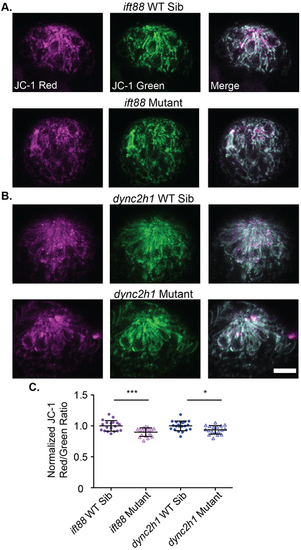
Mitochondrial membrane potential is slightly reduced in IFT gene mutants. (A) Representative images of neuromasts from (A) ift88 or (B) dync2h1 wild-type siblings (top) and mutants (bottom) labeled with JC-1. Scale bar: 10 µm. (C) Quantification of the JC-1 Red/Green ratio for both ift88 and dync2h1 mutants and wild-type siblings at 5 dpf. There was a significant difference in both mutants by unpaired Student's t-test, P=0.0004 for ift88, shown as ***, and P=0.0105 for dync2h1, shown as *. n=19 wild-type siblings and 18 mutants for ift88 and n=21 wild-type siblings and 18 mutants for dync2h1 mutants. n numbers are not equal for all groups as some images were not usable due to the movement of fish during imaging. |
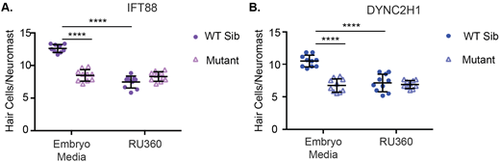
Inhibition of the mitochondrial uniporter decreases hair cell number in wild-type siblings, but not IFT gene mutants. Quantification of hair cells/neuromast in (A) ift88 and (B) dync2h1 wild-type siblings and mutants with or without RU360 treatment. In the case of both mutants genotype, drug treatment, and the interaction between the two variables was a significant source of variation by two-way ANOVA (P<0.0001). ****=P<0.0001 by Šídák's multiple comparisons test comparing the two groups at the edges of the lines under the asterisks. n=10 for all groups with the exception of the ift88 WT sibling EM group where n=9 due to the loss of fish during the staining process. |
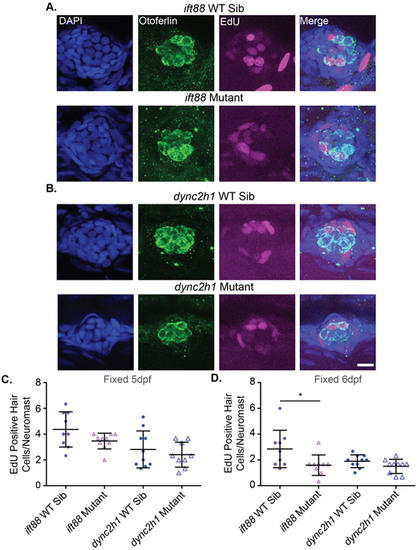
Proliferation during hair cell development is not significantly decreased in both IFT gene mutants. Representative images of neuromasts from (A) ift88 and (B) dync2h1 wild-type siblings (top) and mutants (bottom) at 5 dpf. Cells that proliferated from 3–4 dpf are EdU-positive as shown in magenta. Nuclei are labeled in blue with DAPI and hair cells in green with the otoferlin antibody. Scale bar: 10 µm. (C) Quantification of the number of EdU-positive hair cells/neuromast for each mutant when fixed at 5 dpf. There were no significant differences when comparing wild-type siblings to mutants by unpaired t-test for either mutant (P=0.096 for ift88 and P=0.481 for dync2h1). For ift88 Welch's correction was used due to the unequal variances between wild-type siblings and mutants. n=10 for ift88 mutants and dync2h1 wild-type siblings and n=9 for ift88 wild-type siblings and dync2h1 mutants. (D) Quantification of the number of EdU-positive hair cells/neuromast for each mutant when fixed at 6 dpf. ift88 mutants showed a significant reduction in the number of EdU-positive hair cells as compared to their wild-type siblings (P=0.0411) by unpaired t-test. There were still no significant differences when comparing dync2h1 wild-type siblings to mutants (P=0.1055). n=9 for both ift88 groups and n=10 for both dync2h1 groups. n numbers were not equal in all groups due to the loss of fish in the staining process or issues with images. |
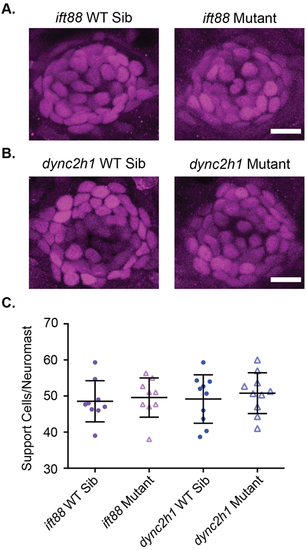
Support cell number is not altered in IFT gene mutants. Representative images of neuromasts from (A) ift88 and (B) dync2h1 wild-type siblings (left) and mutants (right) at 6 dpf stained with a Sox2 antibody to label support cells. Scale bars: 10 µm. (C) Quantification of the number of Sox2 positive support cells/neuromast for each mutant. There were no significant differences when comparing wild-type siblings to mutants by unpaired t-test for either mutant (P=0.6982 for ift88 and P=0.5632 for dync2h1). n=9 for both ift88 groups and n=10 for both dync2h1 groups. n numbers were not equal in all groups due to issues with images. |
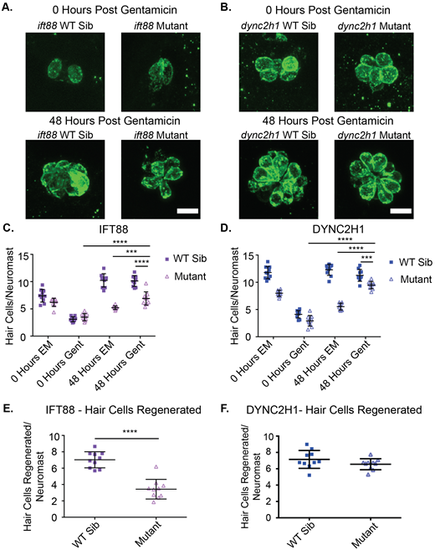
Hair cell number following regeneration is slightly reduced in IFT gene mutants. Representative images of neuromasts with hair cells labeled using the otoferlin antibody in (A) ift88 and (B) dync2h1 wild-type siblings (left) and mutants (right), pre (top) and post (bottom) regeneration. Scale bars: 10 µm. Quantification of hair cells/neuromast for (C) ift88 and (D) dync2h1 wild-type siblings and mutants during the regeneration experiment. EM groups were fish that were kept in EM the first 24 h of the experiment whereas Gent groups were fish that were put in 200 µM gentamicin for the first 24 h of the experiment. 0 h groups were fixed immediately following those first 24 h, whereas 48 h groups were fixed following a 48 h recovery period in EM. A three-way ANOVA was carried out for both experiments which found all variables (time, drug, genotype) to be significant sources of variation as well as all two-way interactions between the three variables (P<0.001). The three-way interaction between variables was found to be significant for the dync2h1 experiment (P=0.003), but not the ift88 experiment (P=0.796). ****=P<0.0001 and ***=P<0.001 by Šídák's multiple comparisons test comparing the two groups at the edges of the lines under the asterisks. The 48-h gentamicin data shown in C and D is also shown in panels E for ift88 and F for dync2h1 following subtraction of the average 0-h gentamicin data for each group. There was a significant difference between ift88 wild-type siblings and mutants ****=P<0.0001, but not for dync2h1 (P=0.1639) by unpaired t-test following this normalization. n=10 for all groups. |
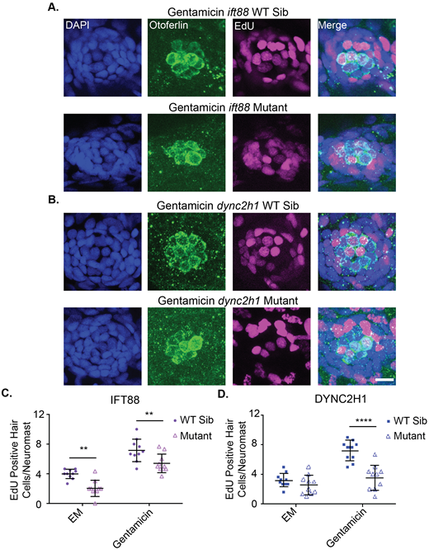
Proliferation during hair cell regeneration is reduced in IFT gene mutants. Representative images of neuromasts from (A) ift88 and (B) dync2h1 wild-type siblings (top) and mutants (bottom) at 7 dpf following gentamicin and EdU treatment from 4-5 dpf. Cells that proliferated during the 4-5 dpf time period are EdU-positive as shown in magenta. Nuclei are labeled in blue with DAPI and hair cells in green with the otoferlin antibody. Scale bar: 10 µm. The graphs show the quantification of EdU-positive hair cells/neuromast for (C) ift88 and (D) dync2h1 wild-type siblings and mutants 48 h after either EM or gentamicin treatment. A two-way ANOVA was carried out for both experiments. For ift88 both drug treatment and genotype were significant sources of variation (P<0.0001) whereas the interaction between the two variables was not (P=0.7884). For dync2h1 both of the individual variables were also significant sources of variation (P<0.0001) as was the interaction between the two variables (P=0.0016). **=P<0.01 and ****=P<0.0001 by Tukey's multiple comparisons test comparing the two groups at the edges of the lines under the asterisks. n=10 for all groups. |