
|
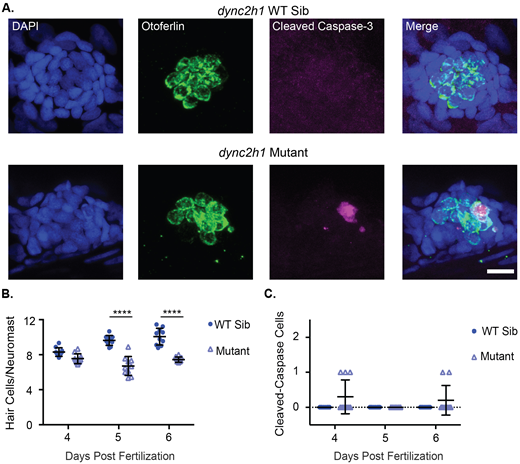
Fig. 2 dync2h1 mutants show decreased hair cell number and hair cells undergoing apoptosis. (A) Representative images of neuromasts from dync2h1 wild-type siblings (top) and dync2h1 mutants (bottom) at 6 dpf. Nuclei are labeled in blue with DAPI, hair cells in green with the Otoferlin antibody and cells undergoing apoptosis in magenta with the cleaved caspase-3 antibody. Scale bar=10 µm. (B) Quantification of hair cells/neuromasts in dync2h1 wild-type siblings and mutants at 4, 5 and 6 dpf. Genotype (P<0.0001), age (P=0.0003), and the interaction between the two variables (P<0.0001) were significant sources of variation by 2-way ANOVA. ****=P<0.001 by Šídák's multiple comparisons test comparing the wild-type siblings and mutants at the different ages. n=10 for each group. (C) Quantification of the total number of cleaved caspase-3 positive hair cells in the 9 neuromasts of the posterior lateral line in dync2h1 wild-type siblings and mutants at 4, 5 and 6 dpf. Genotype was a significant source of variation by 2-way ANOVA (P=0.0169) whereas age (P=0.1918) and the interaction between the two variables (P=0.1918) were not. n=10 for each group.