
|
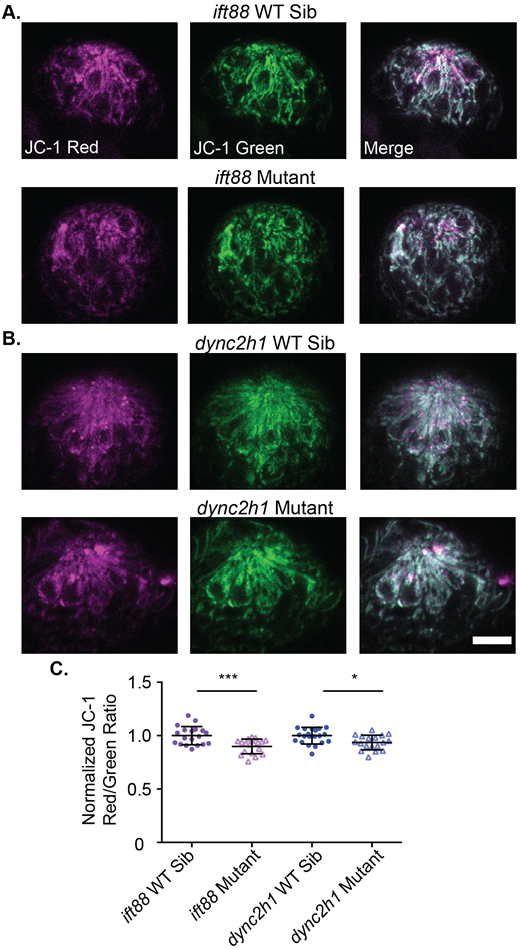
Fig. 3 Mitochondrial membrane potential is slightly reduced in IFT gene mutants. (A) Representative images of neuromasts from (A) ift88 or (B) dync2h1 wild-type siblings (top) and mutants (bottom) labeled with JC-1. Scale bar: 10 µm. (C) Quantification of the JC-1 Red/Green ratio for both ift88 and dync2h1 mutants and wild-type siblings at 5 dpf. There was a significant difference in both mutants by unpaired Student's t-test, P=0.0004 for ift88, shown as ***, and P=0.0105 for dync2h1, shown as *. n=19 wild-type siblings and 18 mutants for ift88 and n=21 wild-type siblings and 18 mutants for dync2h1 mutants. n numbers are not equal for all groups as some images were not usable due to the movement of fish during imaging.