
|
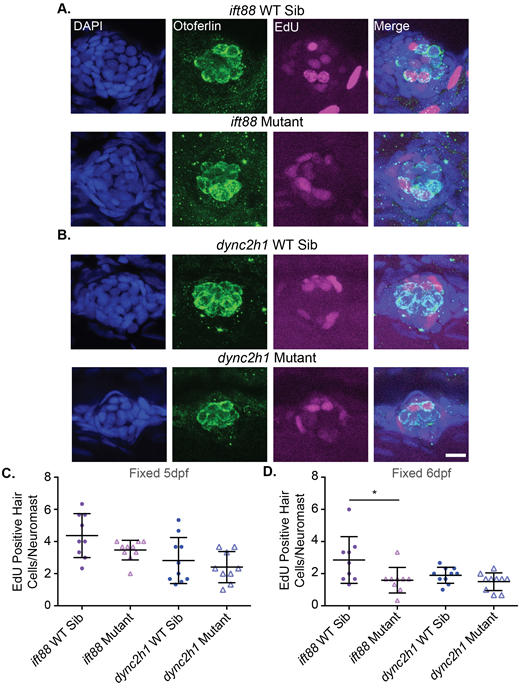
Fig. 5 Proliferation during hair cell development is not significantly decreased in both IFT gene mutants. Representative images of neuromasts from (A) ift88 and (B) dync2h1 wild-type siblings (top) and mutants (bottom) at 5 dpf. Cells that proliferated from 3–4 dpf are EdU-positive as shown in magenta. Nuclei are labeled in blue with DAPI and hair cells in green with the otoferlin antibody. Scale bar: 10 µm. (C) Quantification of the number of EdU-positive hair cells/neuromast for each mutant when fixed at 5 dpf. There were no significant differences when comparing wild-type siblings to mutants by unpaired t-test for either mutant (P=0.096 for ift88 and P=0.481 for dync2h1). For ift88 Welch's correction was used due to the unequal variances between wild-type siblings and mutants. n=10 for ift88 mutants and dync2h1 wild-type siblings and n=9 for ift88 wild-type siblings and dync2h1 mutants. (D) Quantification of the number of EdU-positive hair cells/neuromast for each mutant when fixed at 6 dpf. ift88 mutants showed a significant reduction in the number of EdU-positive hair cells as compared to their wild-type siblings (P=0.0411) by unpaired t-test. There were still no significant differences when comparing dync2h1 wild-type siblings to mutants (P=0.1055). n=9 for both ift88 groups and n=10 for both dync2h1 groups. n numbers were not equal in all groups due to the loss of fish in the staining process or issues with images.