
- Title
-
Tyrosyl-DNA phosphodiesterase 2 (Tdp2) repairs DNA-protein crosslinks and protects against double strand breaks in vivo
- Authors
- Anticevic, I., Otten, C., Popovic, M.
- Source
- Full text @ Front Cell Dev Biol
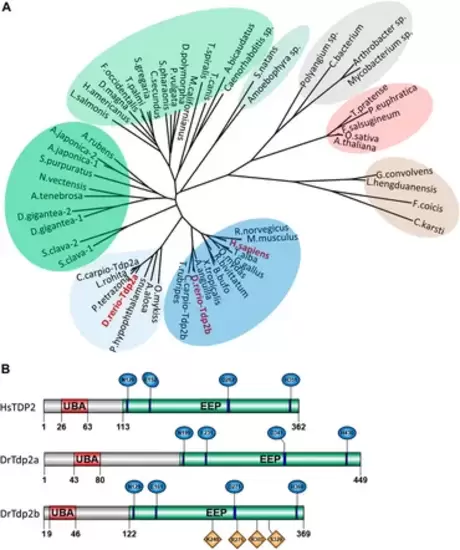
Phylogenetic analysis and domain organization of tyrosyl-DNA phosphodiesterase 2 in humans and zebrafish. (A) Phylogenetic tree of tyrosyl-DNA phosphodiesterase 2 (TDP2). Vertebrate orthologs are shown in blue with an additional cluster of Tdp2 co-orthologs in fish is shown in light blue. Two clusters of invertebrate orthologs are shown in green, algae in light green, plant orthologs in red, fungi in brown, and bacterial cluster in grey. Phylogenetic analysis was performed using the Maximum Likelihood method. (B) Domain structures of human and zebrafish tyrosyl-DNA phosphodiesterase 2 (UBA - ubiquitin-associated domain; EEP-exonuclease/endonuclease/phosphodiesterase catalytic domain). Conserved catalytic motifs bearing catalytic residues are shown in blue and DNA binding sites in Tdp2b are shown in orange. |

Syntenic analysis of human and zebrafish TDP2 and mRNA expression patterns in embryos and adults. (A) Synteny analysis of zebrafish and human TDP2 genes. The schematic shows the chromosomal positions of the zebrafish and human TDP2 genes as determined using the Genomics database. The numbers next to the gene names indicate their respective position in megabase pairs (Mbp) on the respective chromosome. (B) mRNA expression profiles of tdp2a and tdp2b during zebrafish embryonic development from 6 h post-fertilization (6 hpf) to 5 days post-fertilization (5 dpf), normalized to the housekeeping gene ATP synthase peripheral stalk (atp50). (C) Tissue expression pattern of tdp2a and (D) tdp2b in adult zebrafish: brain, liver, kidney, intestine and gonads. Statistically significant differences (*p < 0.05, **p < 0.01, ***p < 0.001) were determined by unpaired t-test. Data are presented as MNE (mean normalized expression) ± SEM (n = 3), normalized to the housekeeping gene ATP synthase peripheral stalk subunit (atp50). |
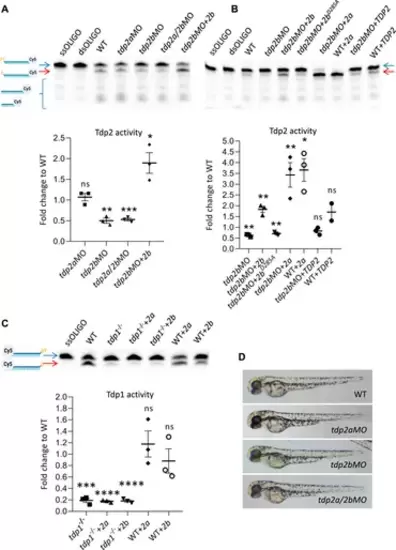
The effects of tdp2 silencing and overexpression on Tdp1 and Tdp2 enzymatic activity and phenotype in zebrafish embryos. (A) Tdp2 activity in 2 dpf zebrafish embryos after silencing tdp2a, tdp2b or tdp2a/2b, and overexpression of tdp2b in a tdp2b-silenced background. Upper panel shows the processing of a Tdp2-specific substrate (5′ (pY)) (blue arrow) after incubation with embryo lysate (10 μg), with ssOLIGO and dsOLIGO as negative controls. The scheme illustrates the reaction products, indicating the Tdp2-mediated removal of tyrosine from the 5′ end (p). Reduced Tdp2 activity is reflected by a lower band intensity of the 5′end (p) product (red arrow). Lower panel shows the quantification of the enzymatic reactions. Tdp2 activity was calculated as the ratio between the band intensity of the lower band (5′(p), 3′ (Cy5), red arrow) and the upper unresolved band (5′ (PY), 3′ (Cy5), blue arrow) for each sample. (B) Tdp2 activity in zebrafish embryos after overexpression of catalytically inactive Tdp2bD285A, Tdp2a, or human TDP2 in a tdp2b-silenced background (upper panel) with the corresponding quantification (lower panel). (C) Tdp1 activity in WT and tdp1 mutant embryos (2 dpf) with or without overexpression of Tdp2a or Tdp2b. The scheme shows the Tdp1 substrate oligonucleotide with a tyrosine (pY) at the 3′end and Cy5 at the 5′end, as well as the reaction product following Tdp1-mediated removal of the tyrosine (p) (upper panel) and corresponding quantification (lower panel). Activities are calculated as the ratio between the band intensity of the lower band (3′(p), 5′ (Cy5), red arrow) and the upper unresolved band (3′ (pY), 5′ (Cy5), blue arrow) for each sample from three biological replicates. Schemes of Tdp1 and Tdp2 substrates were created using BioRender.com. The activity data in A, B and C represent the mean fold change from activity observed in WT embryos ±SEM (n = 3). Statistical significance was determined using an unpaired Student’s t-test (* (p < 0.05), ** (p < 0.01), *** (p < 0.001)). (D) Representative pictures of live zebrafish embryos at 2 dpf. Morphological changes were not observed after tdp2a silencing using morpholino oligonucleotides (tdp2aMO), tdp2b silencing (tdp2bMO), and simultaneous silencing of tdp2a and tdp2b (tdp2a/2bMO). |
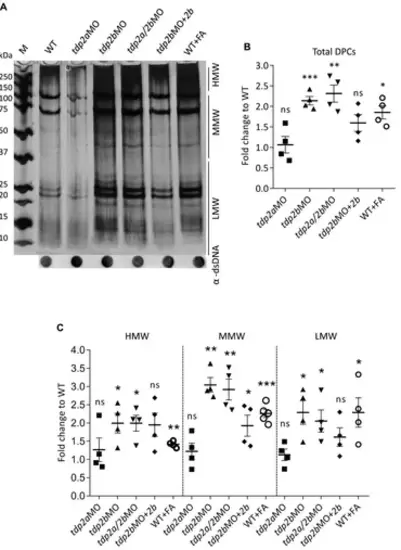
DPC analysis after tdp2 gene silencing and Tdp2b overexpression in zebrafish embryos. (A) DPC analysis for the following conditions: tdp2a-silenced embryos (tdp2aMO); tdp2b-silenced (tdp2bMO); tdp2a- and tdp2b-silenced (tdp2a/2bMO) and Tdp2b overexpression in tdp2b-silenced embryos (tdp2bMO + tdp2b). DPCs were isolated from 2 dpf embryos using the RADAR assay (20-30 embryos per condition, n = 4), resolved on an SDS acrylamide gel, and visualized by silver staining. Dot-blots show DNA loading controls. WT embryos treated with formaldehyde (10 mM, 30 min) were used as a positive control for DPC induction. (B) Quantification of total DPCs from (A). (C) Quantification of DPCs from (A) according to their molecular weight: High Molecular Weight (HMW) (>150 kDa), Medium Molecular Weight (MMW) (40 kDa–150 kDa), and Low Molecular Weight (LMW) DPCs (protein size <40 kDa). The data represent the mean fold change from WT ± SEM (n = 4). Statistical significance was determined using an unpaired Student’s t-test (* (p < 0.05), ** (p < 0.01) and *** (p < 0.001)). |
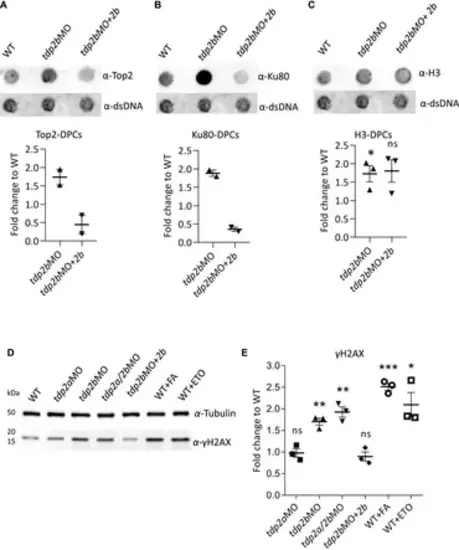
Silencing of tdp2b causes accumulation of Top2-DPCs, Ku80-DPCs and DSBs. (A) Dot blots and corresponding quantifications normalized to WT embryos showing (A) Top2-DPCs (n = 2), (B) Ku80-DPCs (n = 2), and (C) histone H3-DPCs (n = 3) with corresponding DNA loading controls, after tdp2b silencing (tdp2bMO) or Tdp2b overexpression in tdp2b-silenced embryos (tdp2bMO+2b). (D) Western blot analysis of γH2AX levels in WT embryos (WT), tdp2a-silenced (tdp2aMO), tdp2b-silenced (tdp2bMO); tdp2a- and tdp2b-silenced (tdp2a/2bMO) and in embryos where Tdp2b was overexpressed in tdp2bMO (tdp2bMO+2b). Tubulin was used as a loading control. WT embryos treated with formaldehyde (10 mM, 30 min) or etoposide (50 μM, 1 h) were used as a positive control for DSB induction. (E) Quantification of (D). Data show the mean fold change compared to WT ± SEM (n = 3). Statistical significance was determined using an unpaired Student’s t-test (* (p < 0.05), ** (p < 0.01) and *** (p < 0.001)). |