
|
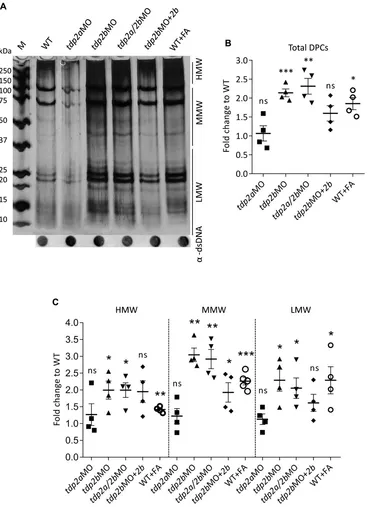
Fig. 4 DPC analysis after tdp2 gene silencing and Tdp2b overexpression in zebrafish embryos. (A) DPC analysis for the following conditions: tdp2a-silenced embryos (tdp2aMO); tdp2b-silenced (tdp2bMO); tdp2a- and tdp2b-silenced (tdp2a/2bMO) and Tdp2b overexpression in tdp2b-silenced embryos (tdp2bMO + tdp2b). DPCs were isolated from 2 dpf embryos using the RADAR assay (20-30 embryos per condition, n = 4), resolved on an SDS acrylamide gel, and visualized by silver staining. Dot-blots show DNA loading controls. WT embryos treated with formaldehyde (10 mM, 30 min) were used as a positive control for DPC induction. (B) Quantification of total DPCs from (A). (C) Quantification of DPCs from (A) according to their molecular weight: High Molecular Weight (HMW) (>150 kDa), Medium Molecular Weight (MMW) (40 kDa–150 kDa), and Low Molecular Weight (LMW) DPCs (protein size <40 kDa). The data represent the mean fold change from WT ± SEM (n = 4). Statistical significance was determined using an unpaired Student’s t-test (* (p < 0.05), ** (p < 0.01) and *** (p < 0.001)).