
|
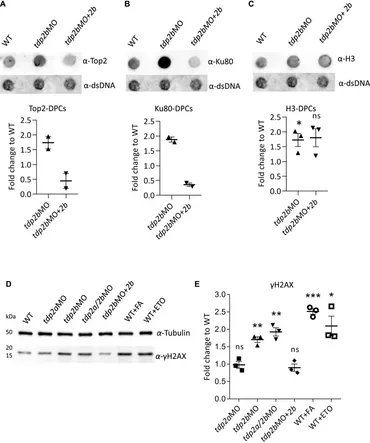
Fig. 5 Silencing of tdp2b causes accumulation of Top2-DPCs, Ku80-DPCs and DSBs. (A) Dot blots and corresponding quantifications normalized to WT embryos showing (A) Top2-DPCs (n = 2), (B) Ku80-DPCs (n = 2), and (C) histone H3-DPCs (n = 3) with corresponding DNA loading controls, after tdp2b silencing (tdp2bMO) or Tdp2b overexpression in tdp2b-silenced embryos (tdp2bMO+2b). (D) Western blot analysis of γH2AX levels in WT embryos (WT), tdp2a-silenced (tdp2aMO), tdp2b-silenced (tdp2bMO); tdp2a- and tdp2b-silenced (tdp2a/2bMO) and in embryos where Tdp2b was overexpressed in tdp2bMO (tdp2bMO+2b). Tubulin was used as a loading control. WT embryos treated with formaldehyde (10 mM, 30 min) or etoposide (50 μM, 1 h) were used as a positive control for DSB induction. (E) Quantification of (D). Data show the mean fold change compared to WT ± SEM (n = 3). Statistical significance was determined using an unpaired Student’s t-test (* (p < 0.05), ** (p < 0.01) and *** (p < 0.001)).