
Fig. 3
- ID
- ZDB-FIG-240904-29
- Publication
- Anticevic et al., 2024 - Tyrosyl-DNA phosphodiesterase 2 (Tdp2) repairs DNA-protein crosslinks and protects against double strand breaks in vivo
- Other Figures
- All Figure Page
- Back to All Figure Page
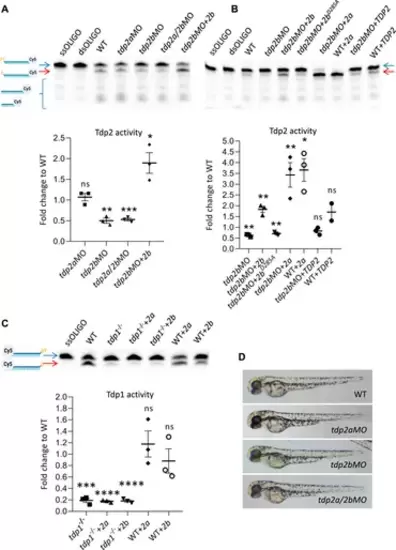
The effects of tdp2 silencing and overexpression on Tdp1 and Tdp2 enzymatic activity and phenotype in zebrafish embryos. (A) Tdp2 activity in 2 dpf zebrafish embryos after silencing tdp2a, tdp2b or tdp2a/2b, and overexpression of tdp2b in a tdp2b-silenced background. Upper panel shows the processing of a Tdp2-specific substrate (5′ (pY)) (blue arrow) after incubation with embryo lysate (10 μg), with ssOLIGO and dsOLIGO as negative controls. The scheme illustrates the reaction products, indicating the Tdp2-mediated removal of tyrosine from the 5′ end (p). Reduced Tdp2 activity is reflected by a lower band intensity of the 5′end (p) product (red arrow). Lower panel shows the quantification of the enzymatic reactions. Tdp2 activity was calculated as the ratio between the band intensity of the lower band (5′(p), 3′ (Cy5), red arrow) and the upper unresolved band (5′ (PY), 3′ (Cy5), blue arrow) for each sample. (B) Tdp2 activity in zebrafish embryos after overexpression of catalytically inactive Tdp2bD285A, Tdp2a, or human TDP2 in a tdp2b-silenced background (upper panel) with the corresponding quantification (lower panel). (C) Tdp1 activity in WT and tdp1 mutant embryos (2 dpf) with or without overexpression of Tdp2a or Tdp2b. The scheme shows the Tdp1 substrate oligonucleotide with a tyrosine (pY) at the 3′end and Cy5 at the 5′end, as well as the reaction product following Tdp1-mediated removal of the tyrosine (p) (upper panel) and corresponding quantification (lower panel). Activities are calculated as the ratio between the band intensity of the lower band (3′(p), 5′ (Cy5), red arrow) and the upper unresolved band (3′ (pY), 5′ (Cy5), blue arrow) for each sample from three biological replicates. Schemes of Tdp1 and Tdp2 substrates were created using BioRender.com. The activity data in A, B and C represent the mean fold change from activity observed in WT embryos ±SEM (n = 3). Statistical significance was determined using an unpaired Student’s t-test (* (p < 0.05), ** (p < 0.01), *** (p < 0.001)). (D) Representative pictures of live zebrafish embryos at 2 dpf. Morphological changes were not observed after tdp2a silencing using morpholino oligonucleotides (tdp2aMO), tdp2b silencing (tdp2bMO), and simultaneous silencing of tdp2a and tdp2b (tdp2a/2bMO). |